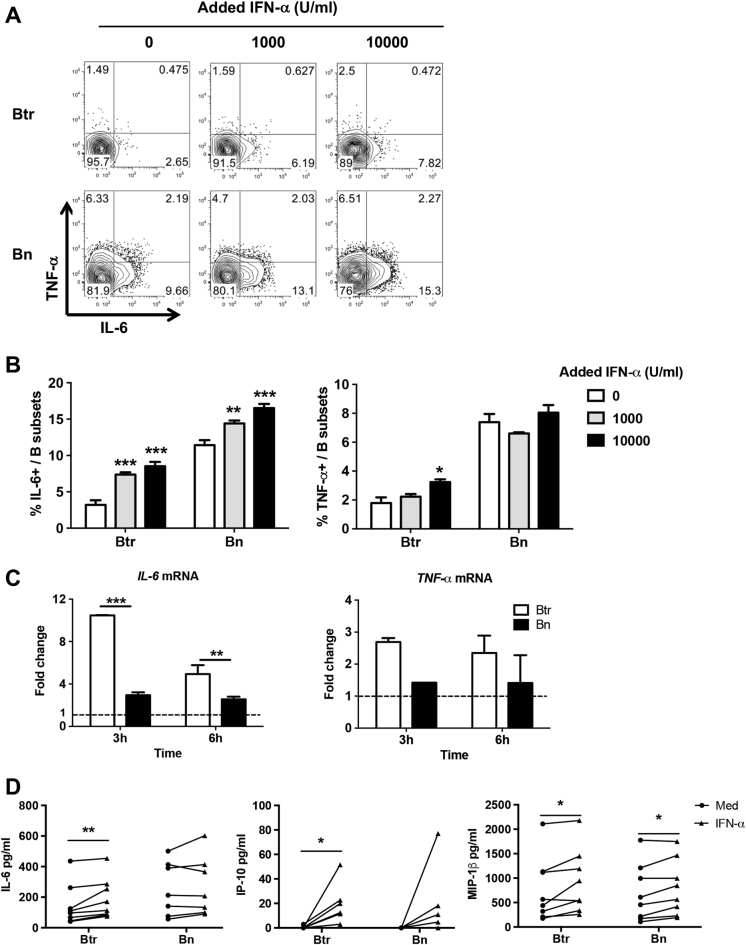
Fig. 6. IFN-α promotes IL-6 expression in transitional B cells.
a, b Purified B cells from healthy donors were cultured with increasing concentrations of IFN-α for 24 h, and PMA/Ionomycin was added in the last 5 h in the presence of Brefeldin A. IL-6- and TNF-α-producing B-cell subsets were measured by flow cytometry. Representative flow cytometry plots (a) and cumulative data (b) show the frequencies of IL-6- and TNF-α-producing Btr and Bn cells. c Purified Btr and Bn cells from healthy donor B cells were stimulated with 10,000 U/ml IFN-α for 3 and 6 h. Bar plots show fold changes of IL-6 and TNF-α mRNA expression of Btr or Bn cells after IFN-α stimulation. d Purified Btr and Bn cells from healthy donor B cells were stimulated with or without 10,000 U/ml IFN-α in the presence of 100 ng/ml PMA and 2 μg/ml Ionomycin for 24 h. Scatter plots show concentrations of IL-6, IP-10 and MIP-1β levels in the supernatants of Btr or Bn cells. Data are represented as means ± SEM and are representative of three experiments (b, c). Data were analyzed by two-way ANOVA with Bonferroni correction for multiple comparisons (b, c) and the Wilcoxon matched pairs test (d). *P < 0.05, **P < 0.01, ***P < 0.001

