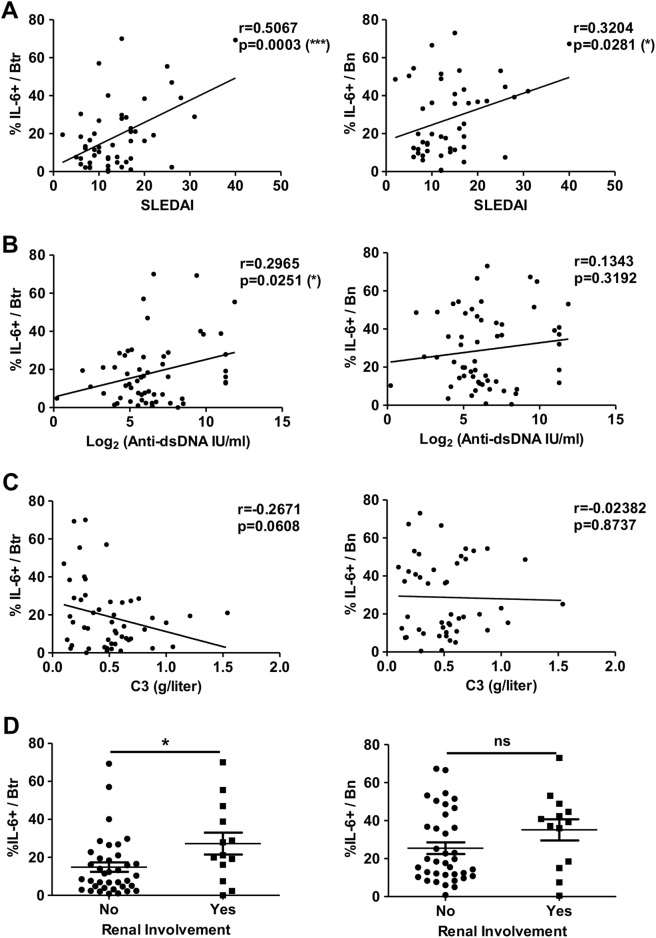
Fig. 7. The frequency of IL-6-producing Btr cells is strongly correlated with disease activities in SLE patients.
Scatter plots show the correlations between the frequency of IL-6-producing Btr (left) or Bn (right) cells and SLEDAI (a), serum anti-dsDNA titers (b) or serum complement C3 levels (c) in new-onset SLE patients. Data were analyzed with Pearson’s correlation. d Scatter plots show the frequency of IL-6-producing Btr (left) or Bn (right) cells in SLE patients with (Yes) or without (No) lupus nephritis. Data are presented as means ± SEM and were analyzed by the Mann–Whitney test. *P < 0.05, ***P < 0.001

