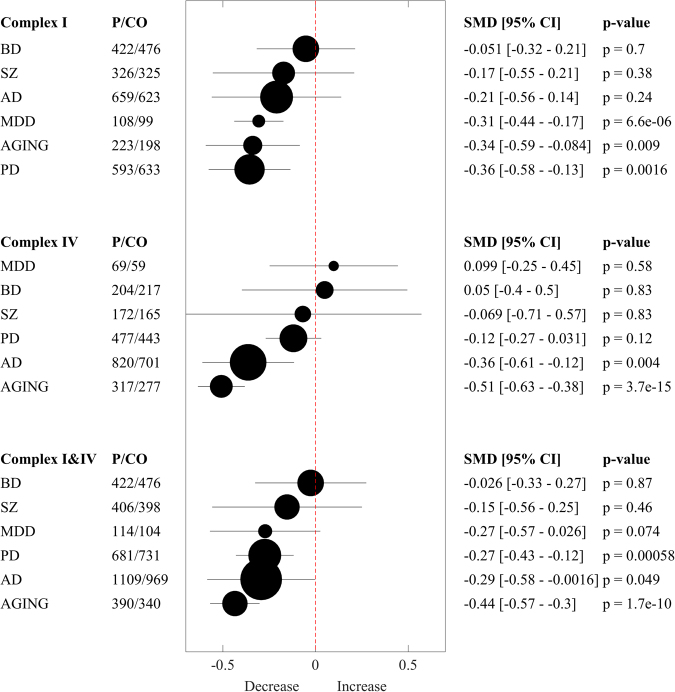
Fig. 3.
Forest plot Summary. Multivariate random-effect estimates of the SMD (95% CI, p-values) of complex I and IV are shown both in numerical and graphical form. SMD are ordered according to their strengths. Values lower than 0 indicate that patients (P) had lower levels than controls (CO), and vice versa for values greater than 0; the dashed vertical line at SMD = 0 indicates no effect. The size of the filled circles for each estimated SMD is proportional to the weight of the studies

