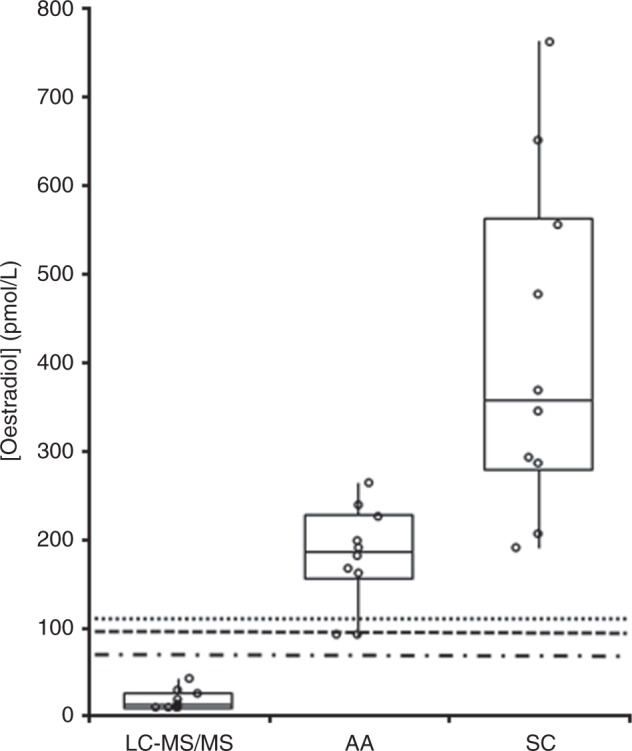
Fig. 1.

The distribution of results for all three assays for patients receiving fulvestrant. The boxes represent the median, 25th, and 75th centile while the whiskers represent the 95% confidence interval. The upper limit of the post-menopausal range has been highlighted for each assay; the dotted line represents the SC assay (118 pmol/L), the dashed line represents the AA assay (103 pmol/L), and the dashed and dotted line represents the MS assay (77 pmol/L)
