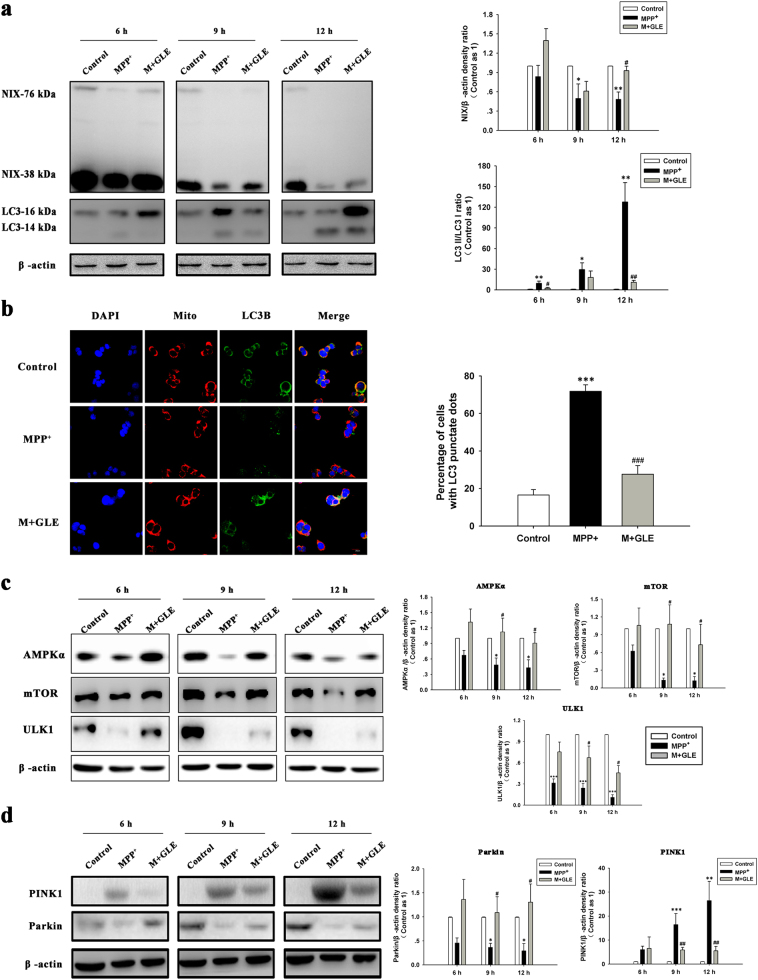
Fig. 4.
GLE administration regulated autophagy induced by MPP+ in neuro-2a cell lines. a Western blot was performed to test the effect of GLE on autophagic events at 6, 9, and 12 h after MPP+ treatment (left), and the immunoreactive band was quantified (right). The occurrence of autophagy was analyzed by examining the LC3-I-to-LC3-II conversion, expressed as the LC3-II/LC3-I ratio. b Representative confocal images of LC3B (green) and mitochondria (MitoTracker dye, red). Nuclei were counterstained with 4′,6′-diamidino-2-phenylindole (DAPI, blue). Cells were treated with MPP+ (1 mM) in the absence or presence of GLE (800 μg/mL) for 6 h. Scale bar, 20 µm (left). Quantification of the percentage of cells with LC3 punctate staining (right). c Representative images of Western blot with antibodies against AMPKα, mTOR, and ULK1 (left). Quantification of these proteins from the Western blot analysis (right). d Western blot analysis of PINK1 and Parkin expression levels (left). Quantification analysis of PINK1 and Parkin expression from Western blot (right). The bands were quantified by densitometric analysis, and results shown represent the mean ± SEM of combined results from three independent experiments. *P < 0.05, ***P < 0.001 vs. the control group; #P < 0.05, ###P < 0.001 vs. the MPP+ group

