Fig. 1.
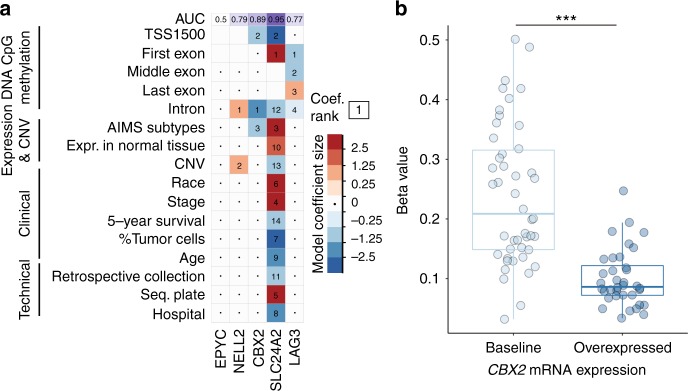
Multi-omic prediction of oncogene candidate mRNA overexpression in breast tumours. a Visualisation of model coefficient selection after regularised logistic regression on binarized (baseline or overexpressed) oncogene candidate mRNA expression levels in breast tumours. Deep blue squares indicate variables that contribute greatly to the prediction of the baseline expression state, whereas deep red squares indicate variables that contribute greatly to the prediction of the overexpressed state. The numbers in each cell indicate the rank of the absolute value of a coefficient relative to all other coefficients for that model, where 1 is the largest model coefficient. Variables not selected as part of the model are indicated with an interpunct (·). Blank cells indicate missing data for a given model. Each model was used to predict whether a sample overexpressed a given OC or not. These predictions were used to generate receiver operating curves, from which the area under the curve (AUC) was derived (top row, purple background). b Association of CBX2 overexpression with DNA methylation beta values for the highest ranking logistic regression coefficient (an intronic CpG locus). DNA methylation values are grouped by level (either baseline or overexpressed) of CBX2 mRNA expression in tumours. Statistical testing was performed using the Wilcoxon rank-sum test (***P-value < 1 × 10⁻⁸)

