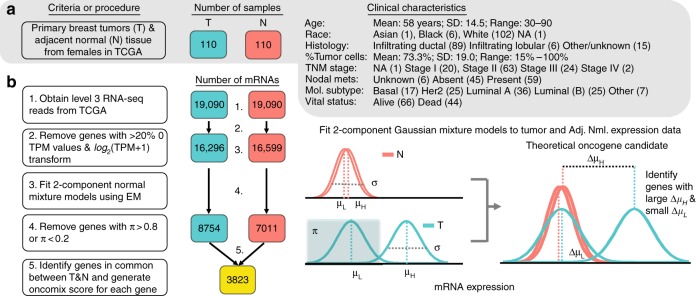
Fig. 2.
Study design to identify oncogene candidates from breast carcinoma and adjacent normal RNA-sequencing samples. a Clinical characteristics of the study cohort of 110 female patients with invasive breast carcinoma. Each of these patients have RNA-sequencing data available from both the primary breast tumour (T) and adjacent normal breast tissue (N). The number of patient samples is indicated within boxes coloured either teal for tumour (T) samples, or orange for adjacent normal (N) samples. The bold type highlights the most common class for each patient characteristic. b Workflow of RNA-seq gene filtering based on transcripts per million mapped reads (TPM). The numbered statements on the right reflect the steps used to transform and filter the data for subsequent analysis. Level 3 mRNA expression data refers to the degree of expression quantification performed by TCGA (see Methods). The number of genes at each step of the workflow is indicated within the coloured boxes. An illustration of a two-component Gaussian mixture model (GMM), shown in teal, used to separately fit each gene’s log2(TPM + 1) values for tumour and adjacent normal controls. GMMs yield several distinct parameters; namely, π is the proportion of samples under the Gaussian associated with lower expression values, μL and μH are the means of the curves that fit lower and higher expression values, respectively, and σ is the common SD of the two Gaussians. The additional subscript (T or N) refers to whether the sample parameters are derived from tumour or adjacent normal expression data. Note that the threshold between baseline and overexpressed is defined by the boundary set from the mixture models in the tumour samples and is the point at which the probability of a sample belonging to either the low or high expression group is equal to 0.5. EM = expectation maximisation

