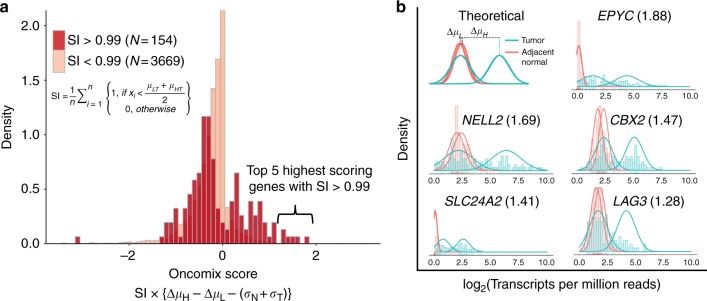
Fig. 3.
Identification of oncogene candidates using RNA-sequencing data from primary invasive breast carcinomas and adjacent normal breast tissue. a The distribution of the oncomix scores separated by genes with a selectivity index (SI) above and below 0.99. Larger oncomix scores correspond to genes that more closely resemble the profile of a theoretical oncogene candidate. b Superimposed histograms of expression values from tumour (teal) and adjacent normal (red) samples for the 5 genes with the highest oncomix score and a SI > 0.99. The best fitting mixture model is shown for each selected gene. The HUGO gene symbol for each gene is displayed for each histogram, with the oncomix score in parentheses. A theoretical model for an ideal oncogene candidate is shown in the upper left. The y axis represents density and the x axis represents log2(Transcripts Per Million + 1) reads. T = primary breast tumour, N = adjacent normal breast tissue, n = total number of adjacent normal samples

