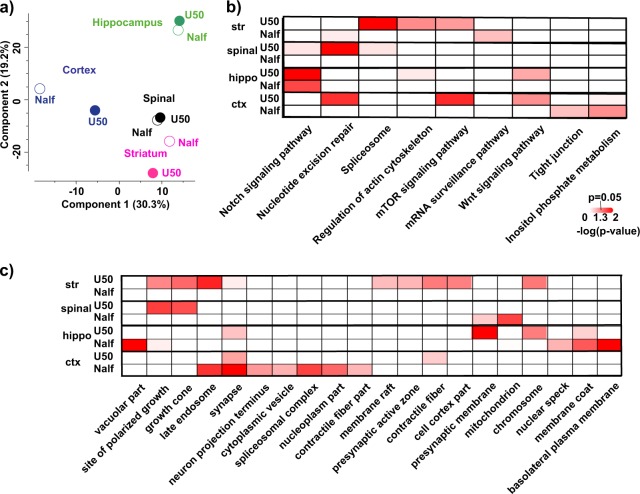
Fig. 3.
Comparison of nalfurafine and U50,488-induced phosphoproteomic changes in brain regions: Mice were injected (s.c.) with vehicle, U50,488H (10 mg/kg), or nalfurafine (30 μg/kg) (n = 3 each) and euthanized 30 min later. Brain regions were dissected for analysis as described in Methods. a Principal component analysis (PCA) of phosphoproteomic changes induced by U50,488 or nalfurafine. Each drug treatment experiment was measured in triplicates and normalized against respective saline control. The median value for each condition was used as inputs for PCA; b Heatmap of annotation matrix analysis. Normalized drug treatment as described in a was used as inputs for annotation matrix analysis. Details are described in Methods. Kyoto Encyclopedia of Genes and Genomes (KEGG) pathway databased was used for the analysis. c Same as in b but gene ontology cellular component was used for the analysis

