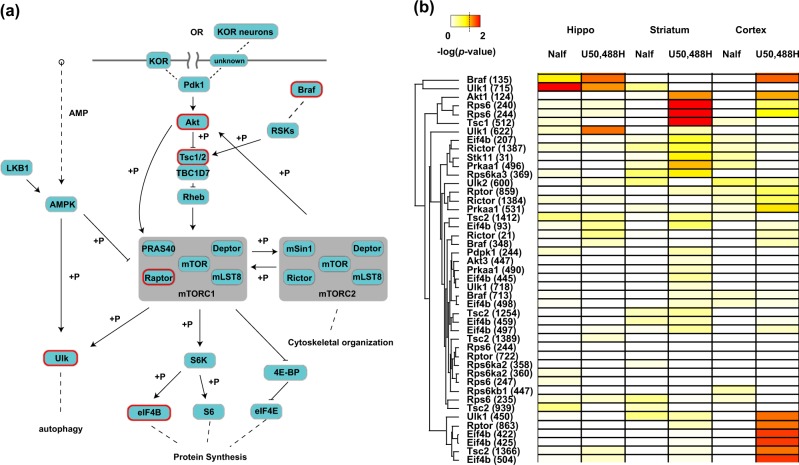
Fig. 4.
KOR-mediated mTOR signaling in the brain: a a schematic drawing of mTOR signaling based on the KEGG pathway. U50,488-, but not nalfurafine-, regulated phosphoproteins in the cortex have been circled in red (also marked with *). “+p” indicates a kinase-substrate relationship. The dotted lines indicate indirect relationship, while the solid lines indicate direct interaction, with the arrow end indicating activation and blunt end indicating inactivation. It should be noted that activation of the mTOR pathway may occur in neurons expressing the KOR, those that do not express the KOR, but are downstream of KOR-containing neurons or both. b A heatmap of phosphoproteins and their sites that are annotated with “mTOR signaling pahtway” using KEGG. The p-value obtained from one-way ANOVA followed by Dunnett’s post-hoc test with respective saline as controls was used to construct the heatmap. The color code is shown top left, with a dotted line indicating the conventional 0.05 cutoff. An unsupervised hierarchical clustering was performed on phosphosites, indicated by the dendrogram on the left. The position of phosphosites on each protein are shown inside the parenthesis next to the gene name. “Nalf” indicates nalfurafine

