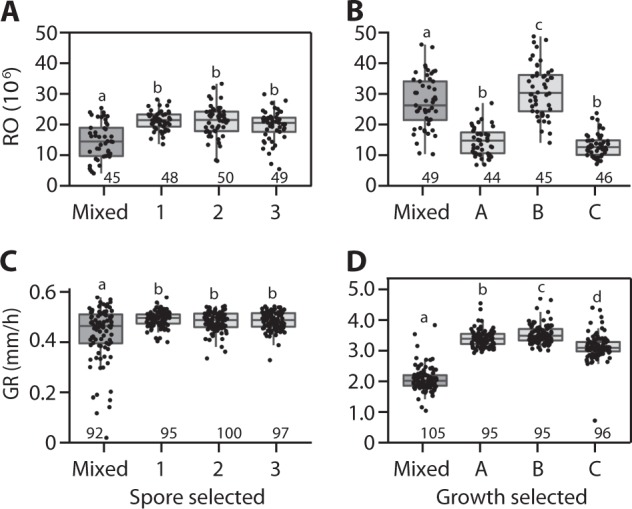
Fig. 5.

Phenotypic responses in populations selected for either reproductive output or growth rate (a, d, respectively) and responses in the non-selected traits (b, c). The mixed population serves as the non-selected ancestral control. Points are means for strains isolated from the mixed population and selected lines. Each strain was measured in triplicate. The number of strains per line is given above the x-axis. Results analyzed via analysis of variance with Tukey’s HSD were used for comparisons among lines. Populations sharing the same letter are not significantly different
