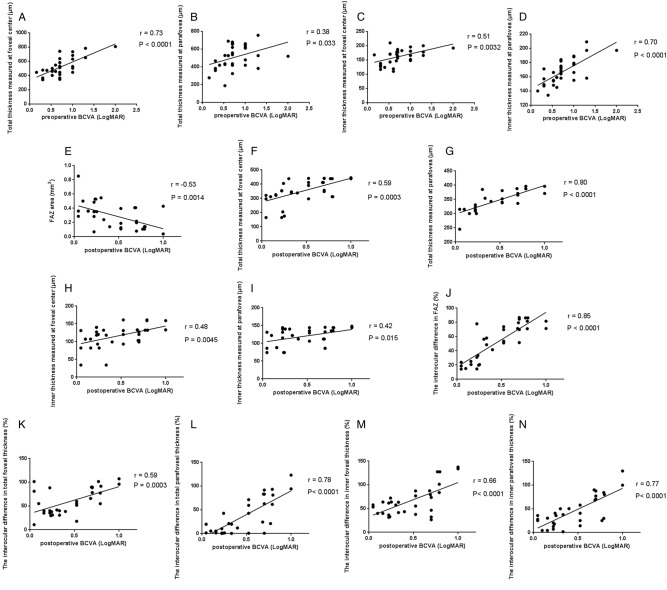
Fig. 1.
Correlations between OCTA parameters and visual outcomes. Scatter plots showing the associations between the a total foveal CRT, b total parafoveal CRT, c inner foveal CRT, d inner parafoveal CRT and pre-operative LogMAR BCVA, respectively. e FAZ area in the treated eyes was negatively correlated with post-operative LogMAR BCVA. Positive associations between f total foveal CRT, g total parafoveal CRT, h inner foveal CRT, i inner parafoveal CRT and post-operative LogMAR BCVA, respectively. Post-operative interocular differences (%) in j FAZ area, k total foveal, l total parafoveal CRT, (m) inner foveal and (n) parafoveal CRT were positively associated with LogMAR BCVA at 6 months after surgery. Pearson’s correlation coefficient (r) and p values for the slope of the regression line are provided in the figure. OCTA optical coherence tomography angiography, CRT central retinal thickness, BCVA best-corrected visual acuity, FAZ foveal avascular zone

