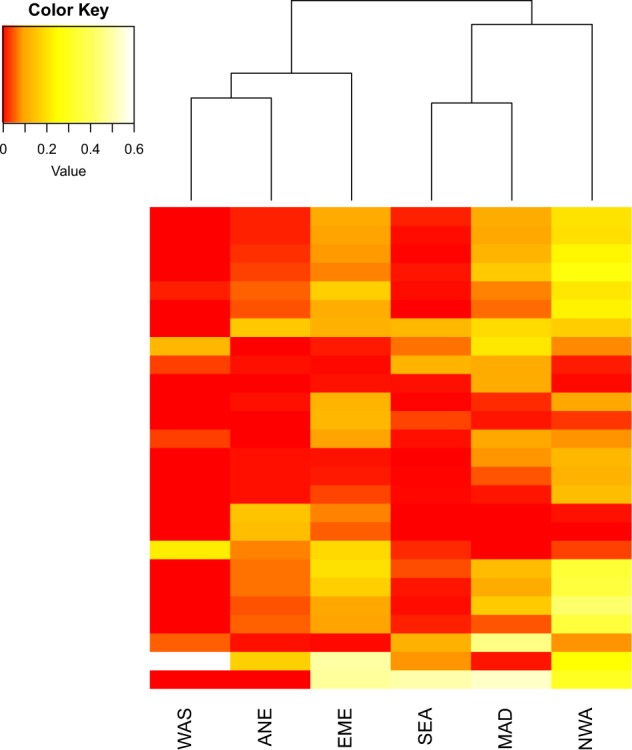
Fig. 3.

Six diverse goat groups were grouped into clusters in heatmap plots based on the top 5% of CNVRs (26 CNVRs). WAS: Western Asia; EME: Eastern Mediterranean; ANE: Alpine & Northern Europe; NWA: Northwestern Africa; SEA: Southeastern Africa; MAD: Madagascar. The value in the legend of the heatmap is CNV event frequency (CNV count in each CNVR /sample size)
