Fig. 4.
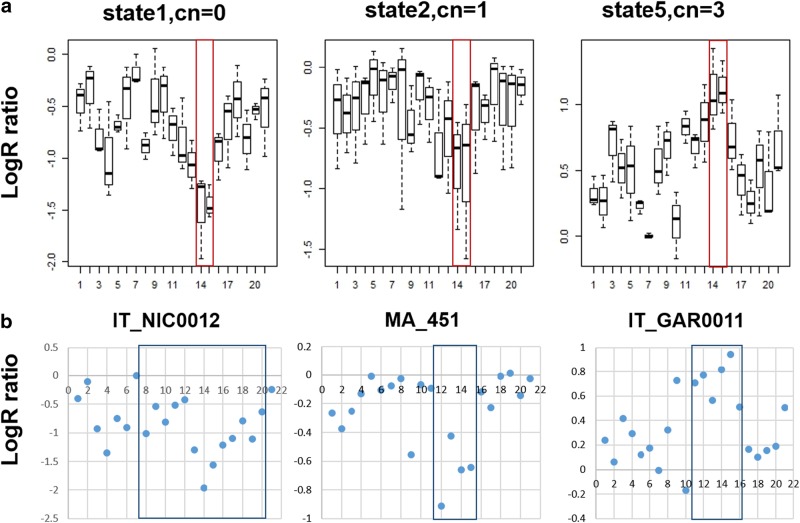
PennCNV plot of Log R Ratio for three different status of DGAT1 CNV within CNVR9. a Boxplot for distributions of LRRs of 21 probes within CNVR9. Probes 14 and 15 in the red box were located in DGAT1. The mean and standard deviation were generated by three sample groups with DGAT1 CNV state 1 (cn = 0), 2 (cn = 1) and 5 (cn = 3), respectively. b Scatter plot of LRR for a CNV event harboring DGAT1 (plots in blue box) in three individuals randomly selected. IT_NIC0012, MA_451, and IT_GAR0011 were defined as state1 (cn = 0), state2 (cn = 1), and state5 (cn = 3) by PennCNV, respectively. Only CNVs, spanning at least 3 probes with a standard deviation (SD) of LRR < 0.30, were reported

