Fig. 1.
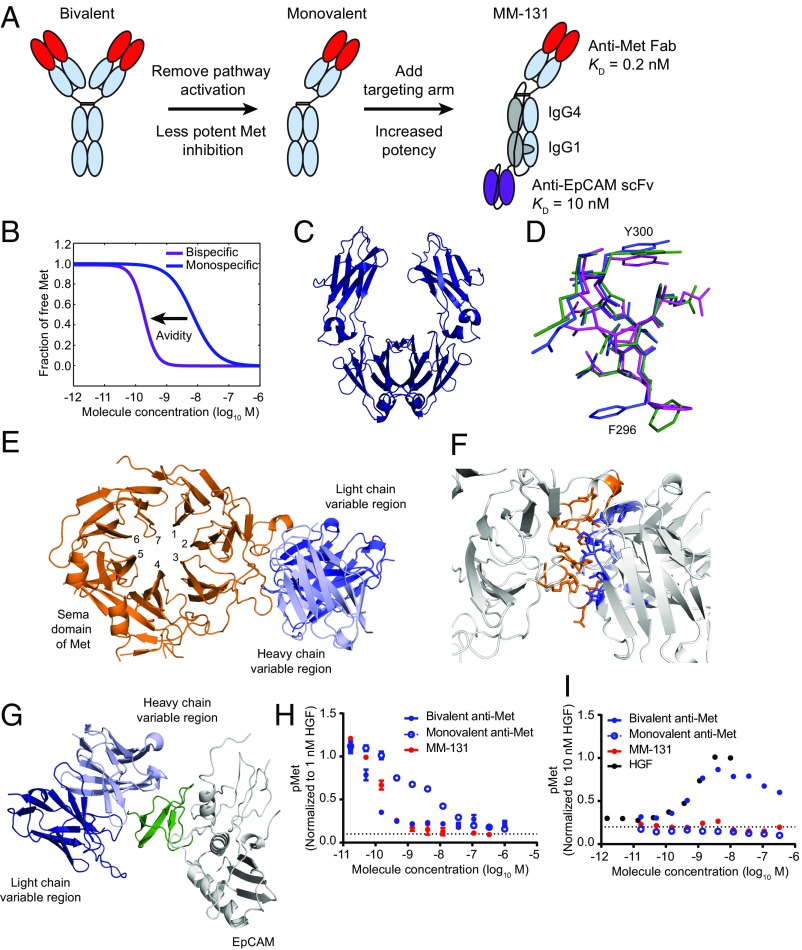
Design of a bispecific anti-Met antibody cotargeting EpCAM (MM-131). (A) Schematic of the design of MM-131. To ensure monovalency for Met, the Fc region was engineered to include “knob-into-hole” mutations, a C-terminal disulfide bond, and a linker connecting the Fc regions. (B) Simulation of Met inhibition by a monovalent, monospecific antibody without a targeting arm (Kd = 0.2 nM) and the increased avidity afforded by inclusion of an EpCAM targeting arm (Kd = 10 nM). Simulations were performed assuming Met expression of 105 receptors per cell and EpCAM expression of 106 receptors per cell. (C) Ribbon diagram of the Fc region of MM-131. (D) DE loop of the Fc domain of MM-131 (green), overlaid with the glycosylated IgG4 CH2 domain of PDB ID code 4C54 (purple) and the aglycosylated IgG4 CH2 domain of PDB ID code 4D2N (blue). (E) Ribbon diagram of the anti-Met Fab of MM-131 (blue), cocrystallized with the Sema domain of Met (orange). (F) Close-up view of the interface between MM-131 (blue) and the Sema domain of Met (orange). (G) Ribbon diagram of the anti-EpCAM scFv of MM-131 (blue), cocrystallized with the extracellular domain of EpCAM (gray). The N-terminal domain of EpCAM (pyroGlu24-Leu62) is highlighted in green. (H) MM-131 potently inhibits HGF-mediated phosphorylation of Met. MM-131 was compared with monovalent anti-Met Fab and with bivalent anti-Met IgG, both based on the anti-Met–binding domain of MM-131. Antibodies were incubated with HT-29 cells for 2 h before 10 min of stimulation with 1 nM HGF. Lysates were analyzed by pMet ELISA; the dotted line indicates the pMet level in the absence of HGF and antibodies (media control). (I) Similar to monovalent anti-Met Fab, MM-131 does not activate Met signaling. HT-29 cells were incubated with HGF, MM-131, bivalent anti-Met, monovalent anti-Met, or media for 10 min. Lysates were analyzed by pMet ELISA; the dotted lines indicate the pMet level of cells in media alone. Plots in H and I reflect mean (n = 4) and SEM.

