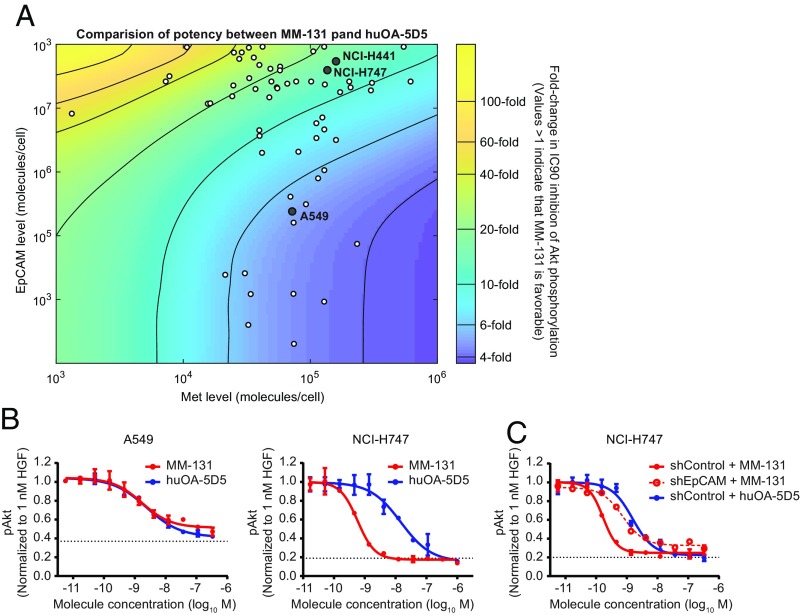
Fig. 2.
EpCAM targeting increases the potency of MM-131. (A) Computational simulation comparing the potency of MM-131 with that of huOA-5D5. For each level of Met expression (x axis) and EpCAM expression (y axis), the IC90 for inhibition of Akt phosphorylation was calculated at 10 min following HGF stimulation. The values in the heat map indicate the fold change between MM-131 and huOA-5D5 (values >1 indicate that MM-131 is favorable). Dots represent a panel of cell lines with different cell surface levels of Met and EpCAM measured by quantitative fluorescence-activated cell sorting. (B) Testing model predictions in cell lines with low and high ratios of EpCAM/Met (0.33 for A549 and 28.9 for NCI-H747). (C) Testing model predictions in an isogenic cell line in which EpCAM was stably knocked down by RNAi. The EpCAM/Met ratio in NCI-H747 shEpCAM is 1.74. Antibodies were incubated with the indicated cell lines for 2 h before 10 min of stimulation with 1 nM HGF. Lysates were analyzed by pAkt ELISA; the dotted lines indicate the pAkt level in the absence of HGF and antibodies (media control). Plots in B and C reflect mean (n = 4) and SEM.

