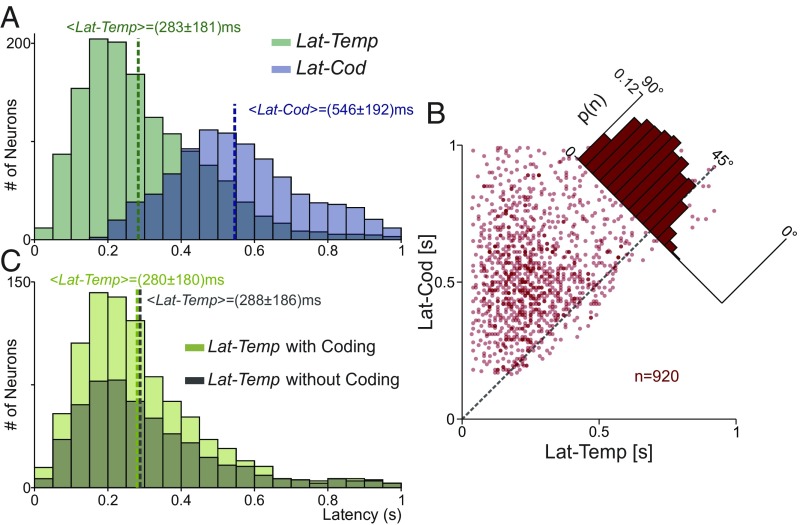
Fig. 2.
Temporal and coding latency variances. (A) Latency distribution for neurons with temporal (green; n = 1,436) or coding (blue; n = 946) variance statistically different from their basal values during P1. In general, pure temporal signal (<LatTemp> = 283 ± 181 ms) appeared before coding signals (<LatCod> = 546 ± 192 ms). (B) Neurons with significant latencies of temporal and coding variances (n = 920). LatTemp (x axis) is plotted against LatCod (y axis). Each dot corresponds to one neuron. Single-neuron latencies were higher for coding than for temporal variances. (C) Latency distributions of temporal variance for neurons with significant LatTemp and LatCod (n = 920; light green) and for neurons with only significant LatTemp (n = 516; dark green). Latency distributions are statistically the same in both groups (<LatTemp> = 280 ± 180 ms vs. <LatTemp> = 288 ± 186 ms). Response temporal latencies were very much alike for neurons with significant temporal and coding responses and for neurons with only significant temporal signals.

