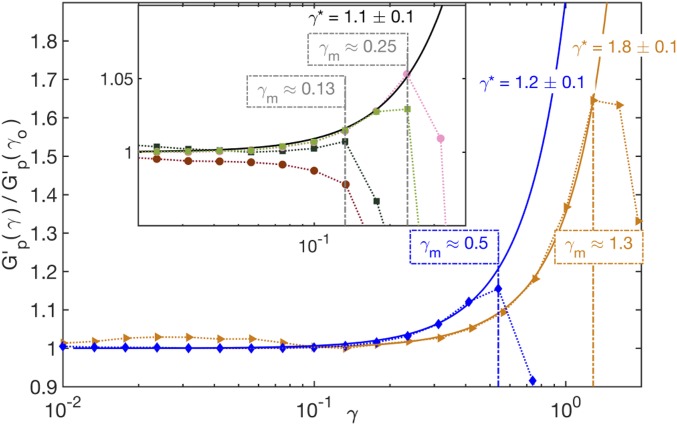
Fig. 3.
Normalized plateau modulus, , of DNAns networks as a function of strain, , in the elastic plateau regime ( rad/s, T = 20°C) for (orange triangles) and 4 (blue diamonds) at [DNAns] of and M, respectively. Solid lines are fits of for (), where (vertical dash-dot line) is the strain that maximizes and is the characteristic strain scale for stiffening. (Inset) Same plots for at [DNAns] of M (light green) and M (dark green) and for at [DNAns] of M (pink) and M (dark red). The solid black line denotes , which captures the nonlinear elasticity of the two lower-concentration and networks.

