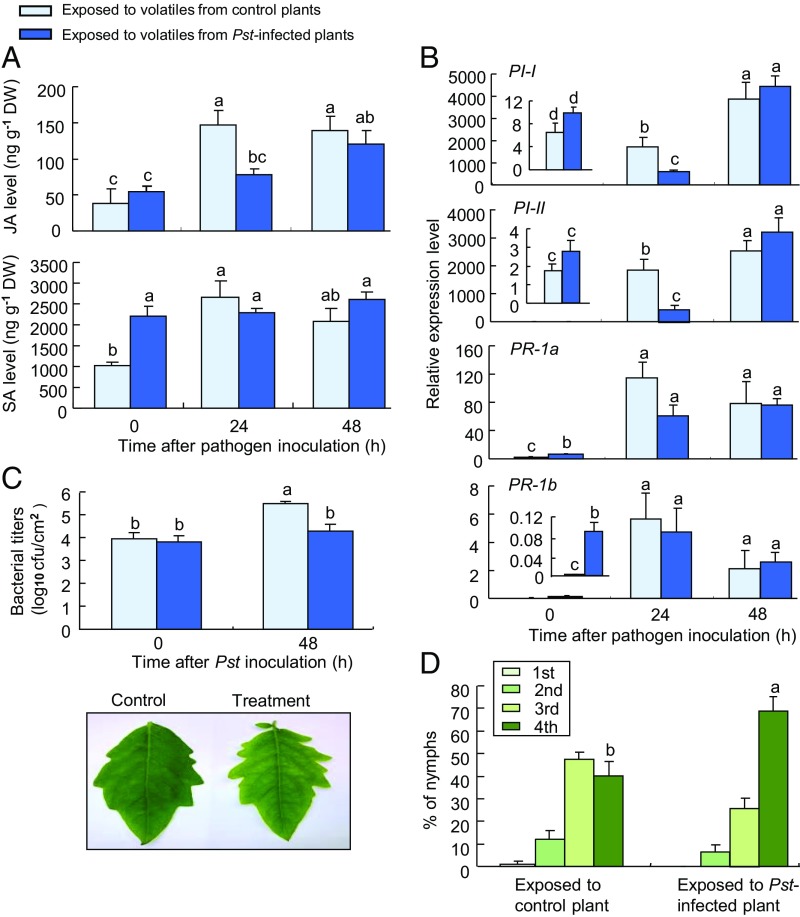
Fig. 5.
Pathogen-induced volatiles prime SA defenses in volatile-exposed tomato plants. (A) Endogenous JA and SA levels in exposed plants after Pst DC3000 infection (n = 3). (B) Expression of defense genes in exposed plants after Pst DC3000 infection (n = 3). (C) Bacterial growth of Pst DC3000 (n = 3). (D) Nymphal performance of whiteflies (n = 10). Error bars correspond to SEs. Different letters above bars indicate significant differences between treatments (P < 0.05; A–C, Tukey’s multiple comparison test; D, likelihood ratio test). DW, dry weight.

