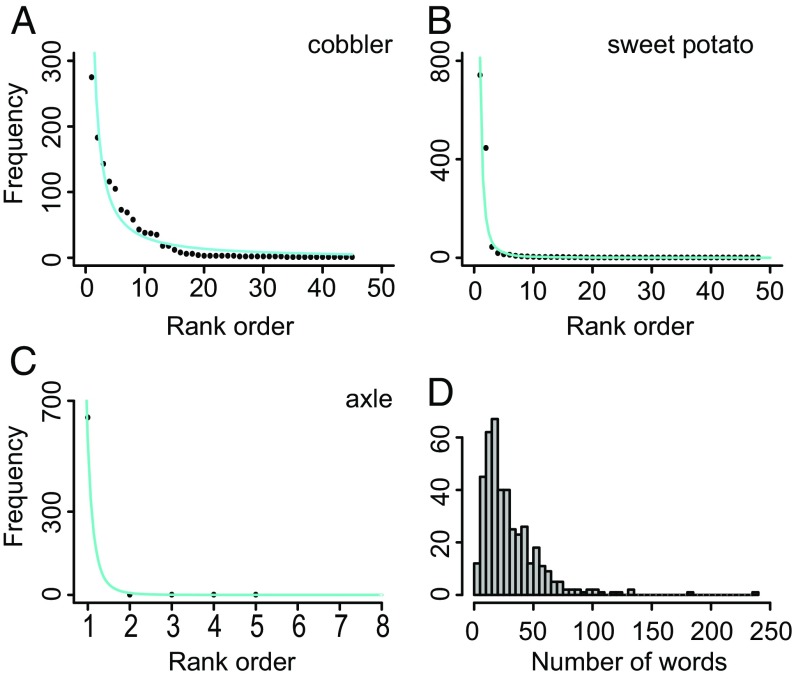
Fig. 1.
(A–C) The frequencies (y axis) of alternative words for the meaning denoted by the word in the upper right corner plotted against their rank order within that list of alternatives (x axis), with smooth curve of the form y = ax−b fitted for descriptive purposes. The exponent b increases (steeper drop off) from A–C, reflecting the decreasing frequency of the second word relative to the first [note: attenuated x axis of C disguises the steepness of the exponent (B)]. (D) Frequency distribution of the number of words per meaning for the n = 418 meanings (mean ± SD = 30.4 ± 25.3, median = 25.3).

