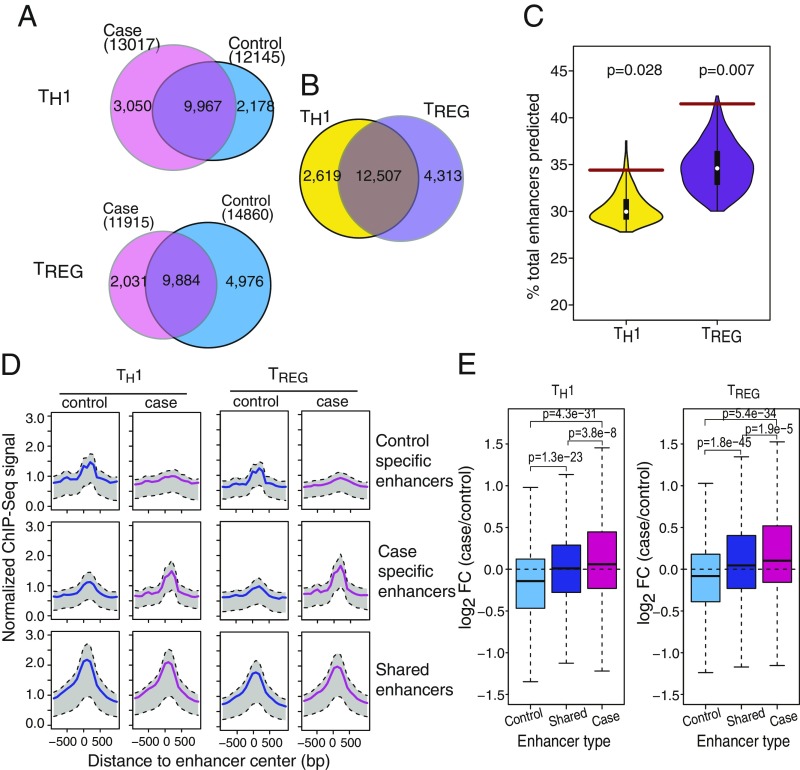
Fig. 2.
Enhancer repertoires of TH1 and TREG cells are significantly altered in T1D patients. (A) Overlap of enhancers between case and control subjects. Enhancers overlapping by >500 bp are considered to be overlapped. (B) Overlap of enhancers between TH1 and TREG cells. For each cell type, the total number of enhancers in case and control subjects is used. (C) P values for observed numbers of group-specific enhancers. Violin plots show the background distribution based on permutated ChIP-seq data. The brown horizontal lines show the observed percentage of group-specific enhancers. (D) Pile-up plots of histone mark H3K27ac signals associated with case-specific, control-specific, and shared enhancers. Signals are normalized by library size and input. (E) Enhancer activity profile is correlated with target gene expression profile (P values are calculated using two-sided Wilcoxon rank-sum test).

