Fig. 6.
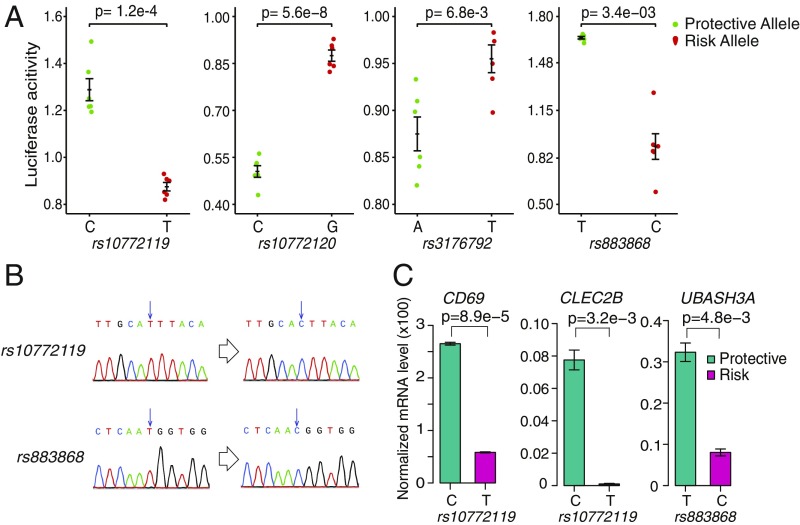
Four risk SNPs affect enhancer activity and target gene expression. (A) Luciferase reporter activity for enhancers containing risk SNPs with protective or risk allele. The green dots are replicates of protective genotype. The red dots represent risk genotype. Data shown are means ± SEM of six replicates. P values are computed using Wilcoxon rank-sum test, two-sided. (B) Sanger sequencing confirmation of genome-edited cells. (C) Effect of genotypes on the expression of target genes in TREG cells measured by RT-qPCR. CRISPR-mediated mutations of three SNPs in TREG cells affect the expression of target genes. The turquoise bars represent protective genotypes, and the magenta bars represent risk genotypes. mRNA level of each gene was normalized to ACTB gene, and relative levels were calculated using the ∆∆Ct method. Data shown are means ± SEM of two biological replicates. P values are computed using Wilcoxon rank-sum test, two-sided.

