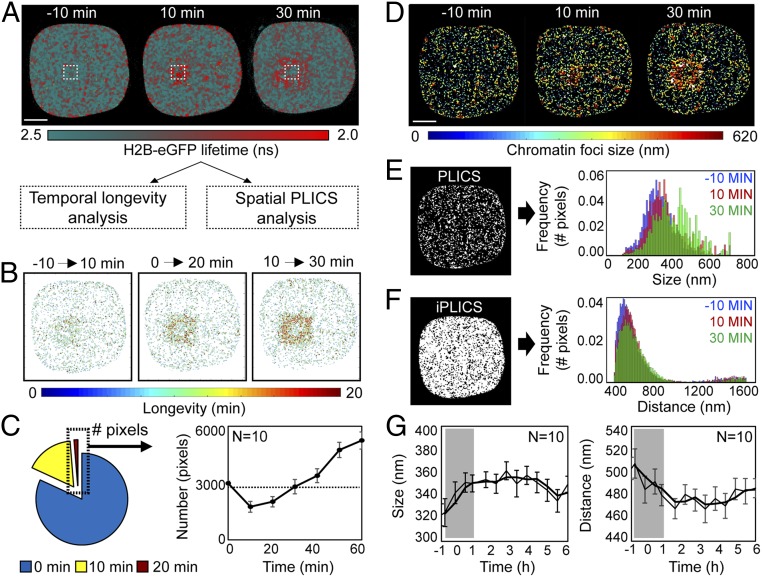
Fig. 4.
A compact chromatin border forms around the lesion site within the first 30 min of the DDR. (A) FLIM-FRET maps acquired in a HeLaH2B-2FP cell during the first 30 min after NIR irradiation. (B) Longevity maps of compact chromatin foci taken at 10-min intervals over a 20-min duration. (C) Quantification of the number of stable compact chromatin pixels across multiple cells (n = 10, mean ± SEM) in the first hour following NIR-induced DSBs (dashed line represents average number of stable compact chromatin pixels in an unperturbed cell). (D) Chromatin compaction size maps derived by PLICS analysis 0–30 min after DSB induction. (E) PLICS analysis of the histogram of sizes induced by DSBs in the data presented in D. (F) iPLICS analysis of the histogram of distance changes induced by DSBs in the data presented in D. (G) Change in mean size and distance between compacted chromatin foci as a function of time during the DDR (n = 10 cells, mean ± SEM). (Scale bars, 5 μm.)

