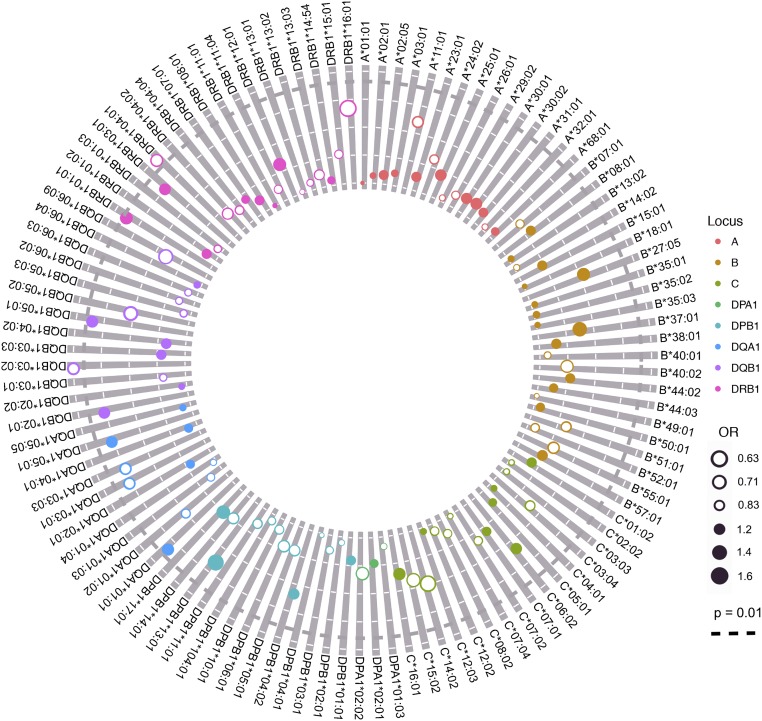
Fig. 1.
Association analysis results for all HLA class I and class II alleles. HLA alleles that were detected in the study population are shown around the perimeter. Decreasing P values are indicated by the distance of points from the center, with P = 0.01 indicated by the black dotted concentric line. The magnitude of ORs is indicated by the diameter of points, with filled points indicating OR >1 and open points indicating OR <1. The magnitude of global linkage disequilibrium between loci is indicated by the width of interior lines.

