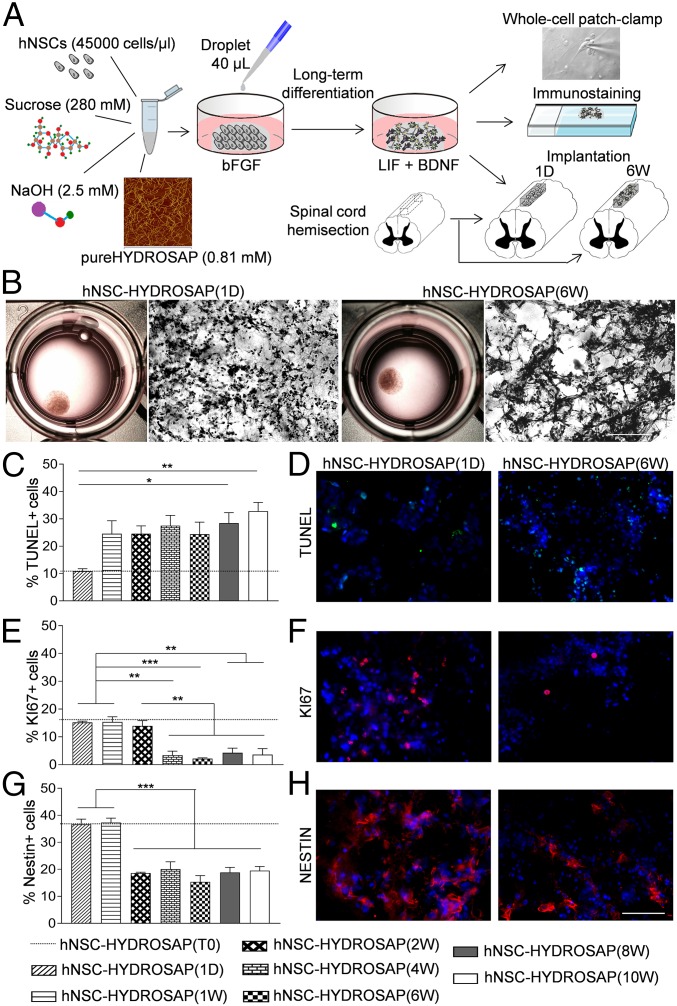
Fig. 1.
Design and 3D cell cultures characterization of hNSC-HYDROSAP. (A) Schematic illustration of overall protocol adopted to prepare hNSC-HYDROSAP, comprising pureHYDROSAP, hNSCs, NaOH, and sucrose solution. Details are described in SI Appendix. A droplet of 40 μL was placed in 24-wells plates with serum-free medium supplemented with bFGF and, subsequently, shifted to a medium with LIF and BDNF supplements. hNSC-HYDROSAP was maintained in culture for the following time points: 0 d (T0 sample), 1 d (1D), and 1, 2, 4, 6, 8, and 10 wk. Three-dimensional cell culture characterization was performed through whole-cell patch-clamp recording for electrophysiological analysis (Top) and immunocytochemical analysis assessing cell apoptosis, proliferation, differentiation, and maturation (Middle). Finally, HYDROSAP alone and two selected hNSC-HYDROSAPs constructs [at 1 DIV, hNSC-HYDROSAP(1D), and at 6 wk, hNSC-HYDROSAP(6W)] were implanted in a rat SCI model (Bottom). (B) Representative images of whole hNSC-HYDROSAP(1D) (Left) and hNSC-HYDROSAP(6W) (Right) constructs and their respective H&E stainings. A more entangled network of cells can be seen at 6 wk in culture. (Scale bar, 100 µm.) (C, E, and G) Time-tracking of cells positive for Tunel assay (C), KI67 (E), and Nestin markers (G) reveal decreased cell viability, proliferation, and stemness over time. All graphs show mean ± SEM of triplicate experiments. Statistical analysis showed significant differences (*P < 0.05; **P < 0.01; ***P < 0.001) using one-way ANOVA analysis of variance followed by Tukey posttest. Dotted lines represent values of positive cells in hNSC-HYDROSAP at T0. (D, F, and H) Fluorescence images of hNSCs progenies in hNSC-HYDROSAP(1D) (Left) and hNSC-HYDROSAP(6W) (Right) positive for Tunel (D, green), KI67 (F, red), and Nestin (H, red) markers. Cell nuclei are costained with DAPI (blue). (Scale bar, 50 µm.)

