Fig. 3.
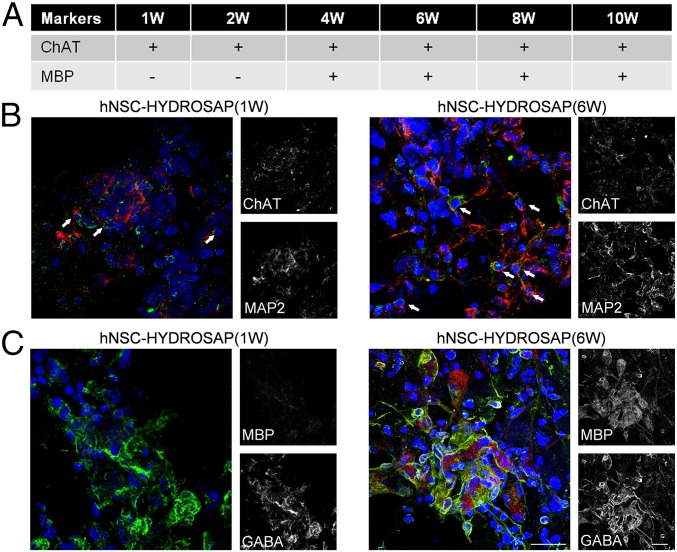
ChAT and MBP markers expression in 3D cell cultures. (A) Table represents expression (+) or absence (−) of ChAT and MBP markers in hNSC-HYDROSAP constructs at different time points. Analysis was performed in triplicate through a Nikon A1 confocal microscope. Marker expression (or its absence) has been verified on three different samples per each experimental group. (B) Colocalization of mature (MAP2 in red), and cholinergic (ChAT in green), neurons for hNSC-HYDROSAP(1W) (Left) and hNSC-HYDROSAP(6W) (Right). White arrows point at signal colocalization. (C) Confocal image confirmed absence of MBP (red) in hNSC-HYDROSAP(1W) (Left column) and its expression in hNSC-HYDROSAP(6W) (Right column). GABAergic neurons are stained with GABA marker (green). A more entangled and mature morphology of positive neuronal cells could be appreciated in hNSC-HYDROSAP(6W). Cell nuclei are labeled with DAPI (blue). (Scale bars, 20 µm in B and C.)

