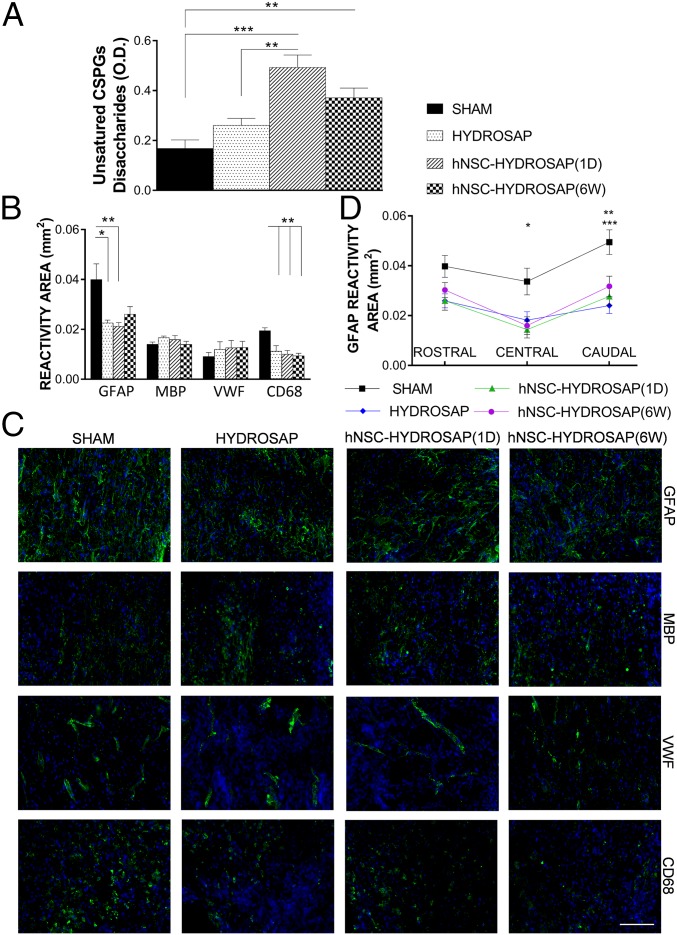
Fig. 7.
Assessment of glial scar formation and inflammatory reaction to HYDROSAP-based implants in SCI. (A) Quantification of unsatured CSPGs was evaluated by UV absorbance measurements at 232 nm. Significantly higher values of unsatured sugar chains were found in hNSC-HYDROSAP(1D) and hNSC-HYDROSAP(6W) groups (SHAM vs. 1 d ***P < 0.001; SHAM vs. 6 wk **P < 0.01; HYDROSAP vs. 1 d **P < 0.01). (B) Computer-based quantification of reactivity areas positive for GFAP (intermediate filament in astrocytes), MBP (myelin sheaths), VWF (blood vessels), and CD68 (myeloid cells). (C) Immunofluorescence stainings of longitudinal spinal cord host tissue surrounding the lesion epicenter. GFAP, MBP, VWF, and CD68 makers are labeled in green. Cell nuclei are stained in blue. (Scale bar, 100 µm.) (D) Regionalized analysis of GFAP expression pointed out significant differences between SHAM and treated groups in central (SHAM vs. 1 d *P < 0.05) and caudal (SHAM vs. 1 d **P < 0.01; SHAM vs. HYDROSAP ***P < 0.001) areas. Data are presented as mean ± SEM (n = 5 per group); significance test was one-way ANOVA with Tukey post hoc.

