Fig. 8.
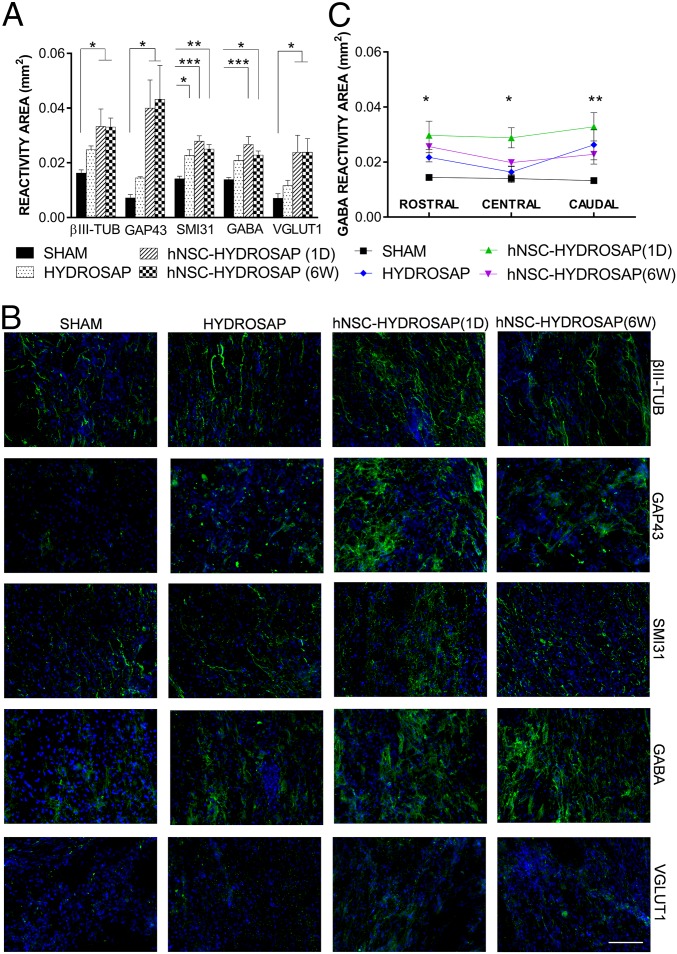
Neuronal markers expression in the injured spinal cords of HYDROSAP-treated animals. (A) Quantification of reactivity areas, comprising host and transplanted cells (when transplanted) surrounding the lesion (longitudinal spinal cord sections), positive for βIII-TUB, GAP43, SMI31, GABA, and VGLUT1 markers revealed significantly increased values for hNSC-HYDROSAP(1D) and hNSC-HYDROSAP(6W) compared with SHAM (*P < 0.05; **P < 0,01; ***P < 0.001). (B) Fluorescence images of immunostainings against βIII-TUB, GAP43, SMI31, GABA, and VGLUT1 markers at 8 wk after treatment. (Scale bar, 100 µm.) (C) Regionalized quantification of GABA revealed a significantly increased reactivity in hNSC-HYDROSAP(1D) compared with SHAM in areas rostral (*P < 0.05), central (*P < 0.05), and caudal (**P < 0.01) to the lesion epicenter. Most GABA+ cells, showed a predominant vertical orientation of their tufts of dendrites, giving rise to ascending/descending vertical processes. All data are presented as mean ± SEM: significance test was Two-way ANOVA followed by Tukey post hoc (n = 5 per group).

