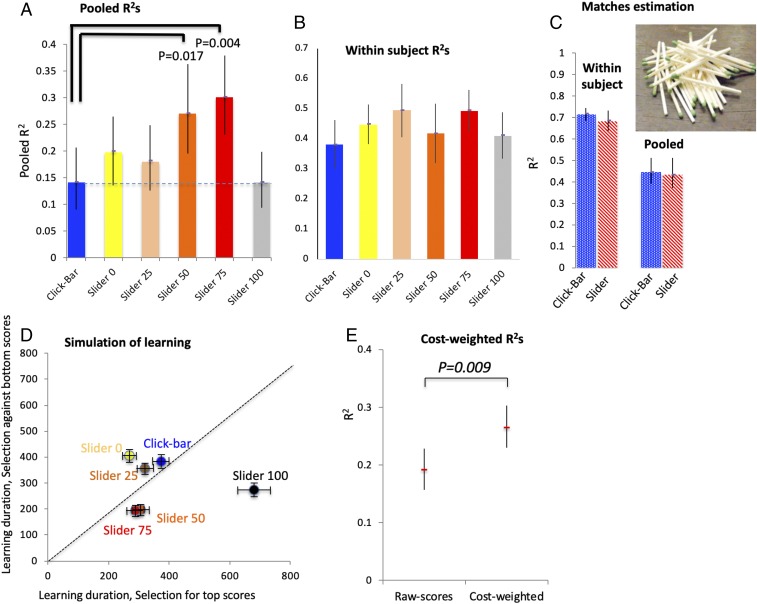
Fig. 2.
Evaluation of crowd wisdom across rating devices. (A) Pooled R2 with 95% confidence intervals for each group. P values are Bonferroni adjusted. (B) Within-subject R2 with 95% confidence intervals for each group. (C) Pooled and within-subject R2 for matches estimation task, comparing click bar (blue, n = 40 subjects), and slider (red, n = 40 subjects). (D) Means and 95% confidence intervals for simulation of learning by an agent that selects and learns to prefer ferry services according to their rating scores. Learning duration is estimated by iterations it takes to reduce selected ferry delays by half. The x axis shows results of an agent that selects for top-scored services, and the y axis shows results for an agent that avoids the bottom-scored services. (E) R2s of raw scores versus weighted R2s of scores by time costs, pooled across all slider groups.

