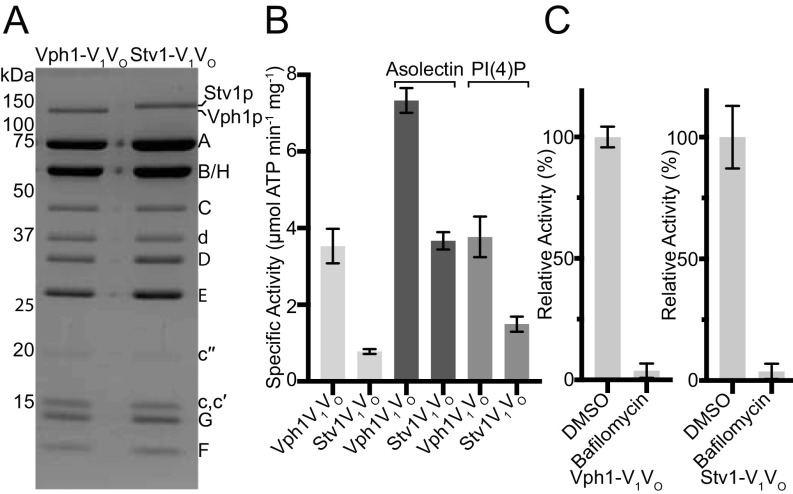
Fig. 1.
Biochemical comparison of Vph1-V1VO and Stv1-V1VO. (A) Coomassie-stained SDS/PAGE gel of Vph1-V1VO and Stv1-V1VO. (B) Specific activity of V-ATPase with no lipids, 100 μg/mL asolectin, or 25 μg/mL PI(4)P. (C) Relative ATPase activity of Vph1-V1VO and Stv1-V1VO in the absence and presence of 1 μM bafilomycin-A1. Data shown are mean ± SD; n = 6 (two biological replicates, three measurements on each).

