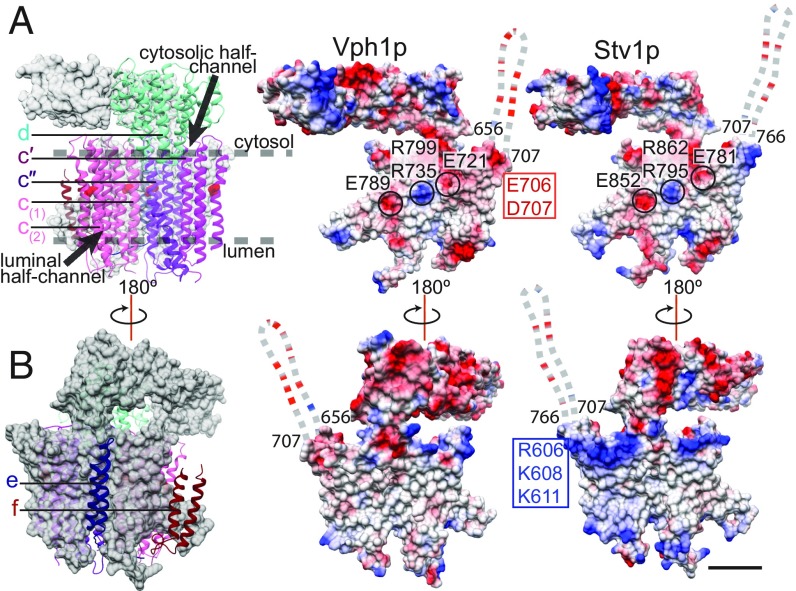
Fig. 4.
Comparison of Stv1p and Vph1p. (A) Surface representation of subunit a (gray), with atomic models for subunits d, c′, c″, c(1), and c(2), and electrostatic surface charge of Vph1p and Stv1p at the c-ring interaction interface. (B) Surface representation of subunit a (gray) with atomic model for subunits e, and f, and electrostatic surface charge of Vph1p and Stv1p at the surface facing the lipid bilayer. Negatively charged residues are highlighted in red; positively charged residues, in blue. The disordered loop near the opening of the cytosolic half-channel is shown as a dashed line. (Scale bars, 25 Å.)

