Fig. 2.
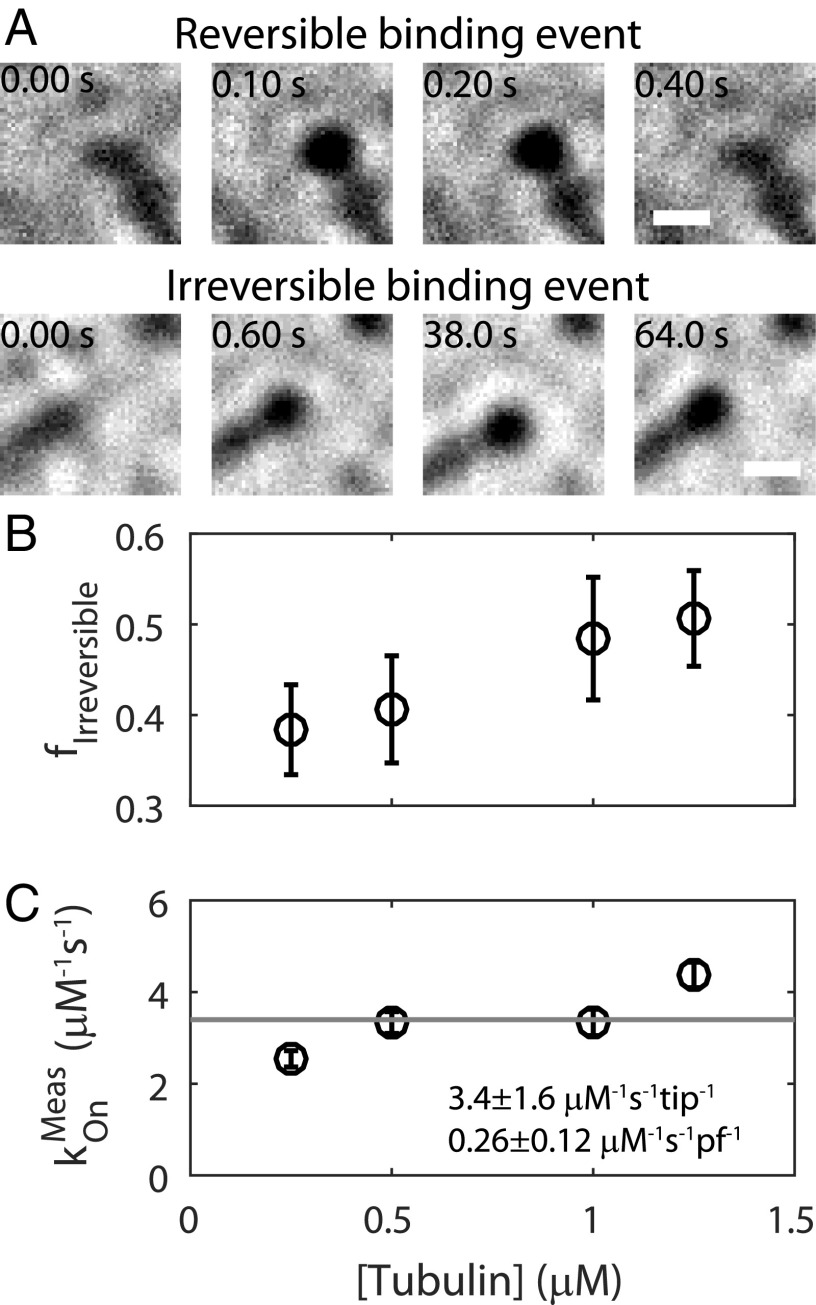
Visualization of single tubulin-gold binding events under iSCAT at 100 frames per second. (A) Example images showing reversible and irreversible tubulin-gold binding events. Irreversible events persisted until the end of individual experiments, with polymerization extending beyond them at longer time scales (see Materials and Methods and Fig. 1C). (B) The fraction (f) of irreversible events observed at each free tubulin concentration. Data shown as mean ± SEM for n = 22 to 34 flow cells. (C) Direct measurement of the tubulin-gold kOn, determined by counting the total number of tubulin-gold binding events per second per micromolar gold nanoparticles. Data are shown as mean ± SEM for n = 22 to 34 flow cells. Value converted to per protofilament (pf) basis by dividing by 13. A Pearson correlation test on the data returned a P value of 0.11, where a value of 0.05 or lower is necessary to reject the null hypothesis that the measured kOn is not correlated with tubulin concentration. All measurements used 1 nM gold nanoparticles.

