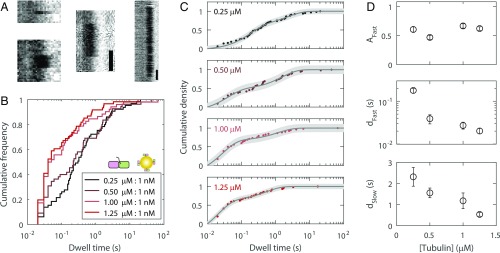
Fig. 3.
Quantification of reversible tubulin-gold tip-dwell times. (A) Example kymographs showing reversible tip-dwell events. (White scale bars: 50 ms; black scale bars: 200 ms.) (B) Distributions showing all reversible dwell time data for four tubulin-KCK concentrations, each with 1 nM 20-nm gold nanoparticles (n = 52 to 66 dwell events). Titrating the labeled fraction in this manner modified the landing frequency of free tubulin-KCK, but not that of gold-bound tubulin-KCK. (C) The data were well-fit with biexponentials. Uncertainty in the fit is shown as a shaded gray area. (D) Best parameters determined from the biexponential fit, shown as fit value ± 95% CI. Inverting the characteristic dwell times dFast and dSlow yields characteristic tubulin dissociation rates.

