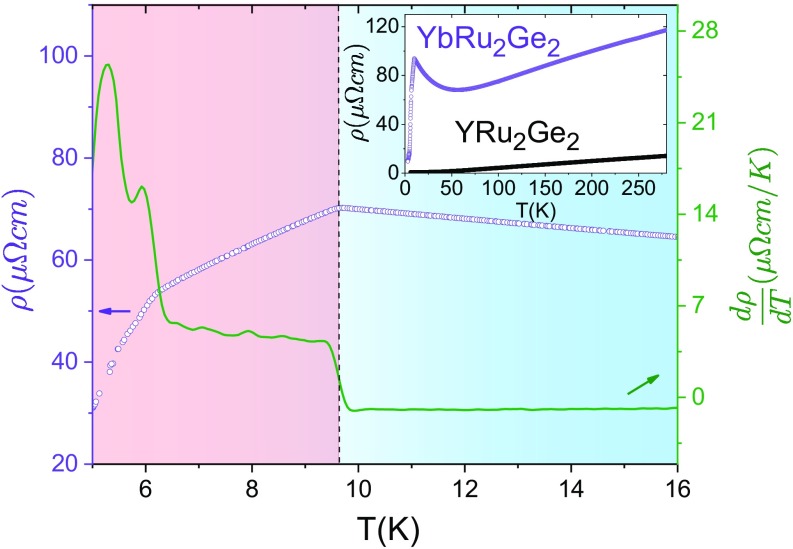
Fig. 4.
Temperature dependence of the resistivity of . The resistivity (purple data points) and its derivative with respect to temperature (green data points) show clear features at (marked by a vertical dashed line), as well as and . Slight differences in estimates of the critical temperatures relative to values extracted from X-ray diffraction measurements are attributed to differences in sweep rates of the two measurements. Inset shows the resistivity over a larger temperature range, in which a different single crystal is measured. Data are also shown for the nonmagnetic analog, , for which no phase transitions are observed. Yttrium has an empty shell but otherwise the electronic structure of the two materials is anticipated to be very similar, and differences in the resistivity between the two compounds are primarily attributed to scattering.

