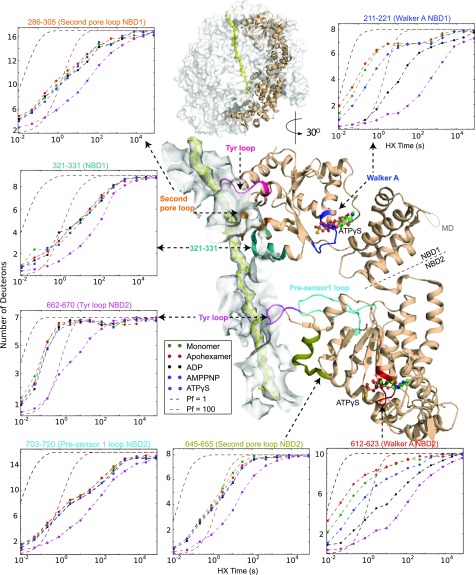
Fig. 5.
Mass centroid plots of the regions that respond significantly to ATPγS binding. An internal view of one protomer (P3) in the closed conformation (ATPγS; PDB ID code 5VJH) is shown. The central pore is represented by a white surface with an enclosed substrate protein (yellow). The somewhat removed position of the Walker A segment with ATPγS bound is shown in the detailed view and placed in molecular context in the overall view above. The centroid plots show a representative peptide from each of these regions (see also the HX centroid plots in SI Appendix, Fig. S10 for Walker A and B, sensors, and Arg fingers in both NBDs). Only the two Walker A segments respond sensitively to the binding of different nucleotides, and the various pore loops respond only to ATP (ATPγS) binding.

