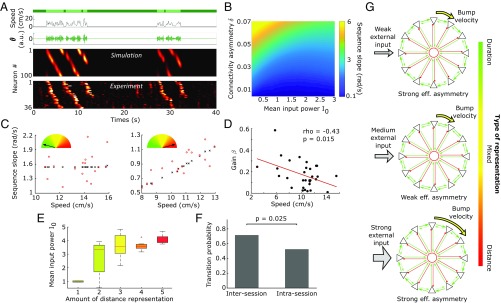
Fig. 3.
Spatiotemporal representation in CANNs. (A) Realistic sequence generation; actual speed of the mouse (Top; dark green, immobility period; light green, run episode), artificial theta oscillation modulated in amplitude (Top Middle), sequences of neuronal activation generated by the CANN (Bottom Middle) and actual neuronal activity recorded in CA1 (Bottom). (B) Phase diagram in the (I0, δ) space with color-coded slope velocities in rad/s. (C) Sequence slope vs. speed for duration (Left) and distance (Right) representation, experimental (red dots) and fitted (black crosses and lines) data. (D) Scatterplot of the fitted gain parameter β and the corresponding median speed of the mouse for the 34 sessions. Linear regression shows a linear dependence between these two quantities (Pearson). (E) Distribution of the mean theta power, I0, according to the distance representation, showing a clear correlation (Spearman’s ρ = 0.73; P = 5e-6). (F) Probability for a transition in coding across sessions (inter) and within sessions (intra). A higher probability for a shift in coding is expected on a longer time scale (χ2 test, P < 0.05). (G) Schematics of the spatiotemporal representation mechanism. For three different input powers, the network effective asymmetry and sequence dynamics (bump velocity) change nonlinearly.

