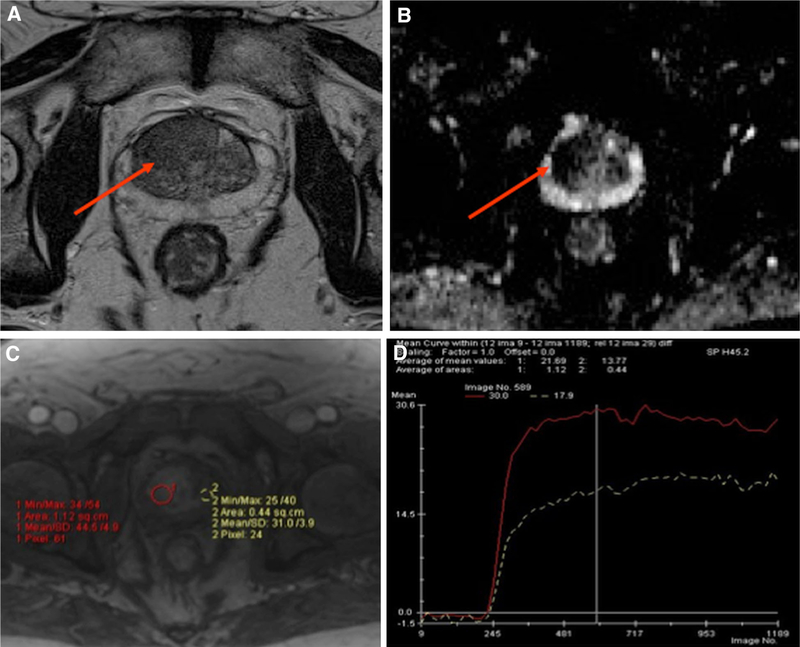
Fig. 4.
Multi-parametric MRI with A T2-weighted B ADC map C DCE and D time-intensity curve of the prostate on a 62-year-old man with a rising PSA of 10.8 and a previous negative prostate biopsy demonstrates a large area of low T2 signal intensity (arrow) with restricted diffusion with ADC of 877 (arrow) and hyperenhancement (red circle) demonstrating a Type 3 curve (red curve) compared normal tissue (yellow circle) demonstrating a Type 1 curve (white curve). Subsequent MRI-US fusion biopsy revealed Gleason 3 + 4.

