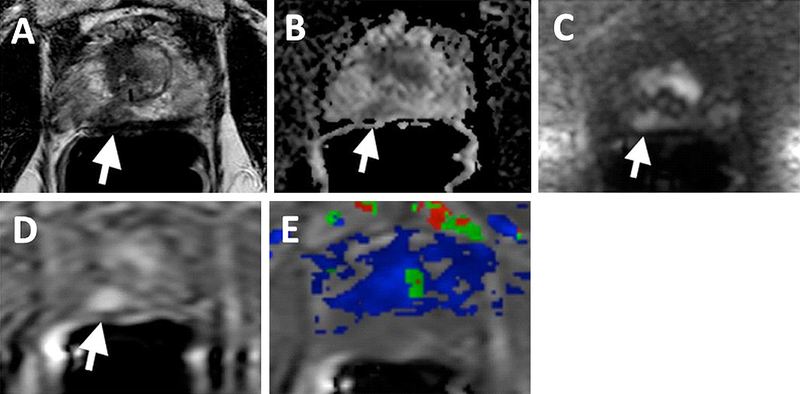
Fig. 6.
70-year-old man with a PSA of 5.67 ng/mL. T2W MRI (A), ADC map (B), b2000 DWI (C), DCE MRI (D) shows a right mid peripheral zone lesion (arrows). Ktrans map derived from DCE MRI (E) is obscured due to motion artifacts and lesion is not localized in the map (supplementary video).

