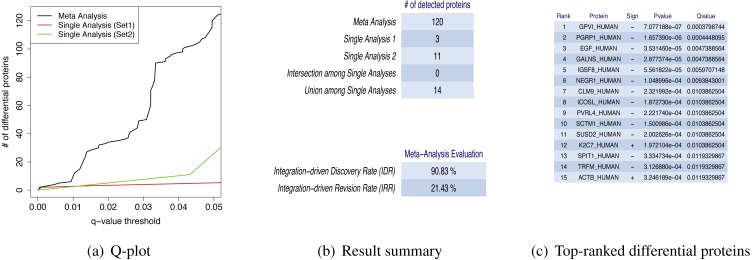
Figure 2. MetaMSD sample outputs.
(A) The q-value threshold vs. # of differential proteins detected by meta-analysis (Stouffer’s test) and single dataset analyses. (B) The numbers of detected proteins and meta-analysis evaluation measures. The top table contains results for a meta-analysis (Stouffer’s test), single analyses using Dataset 1 and 2, the number of commonly detected proteins between single analyses (intersection among Single Analyses), and the number of any proteins detected by single analyses (union among Single Analyses). The bottom table shows the performance measures of the meta-analysis using IDD (Integration-driven Discovery Rate) and IDR (Integration-driven Revision Rate). (C) Top-N differential proteins list ranked by their p-values. MetaMSD displays top-ranked protein names, their signs of log-transformed difference between comparison groups, p-values and q-values.

