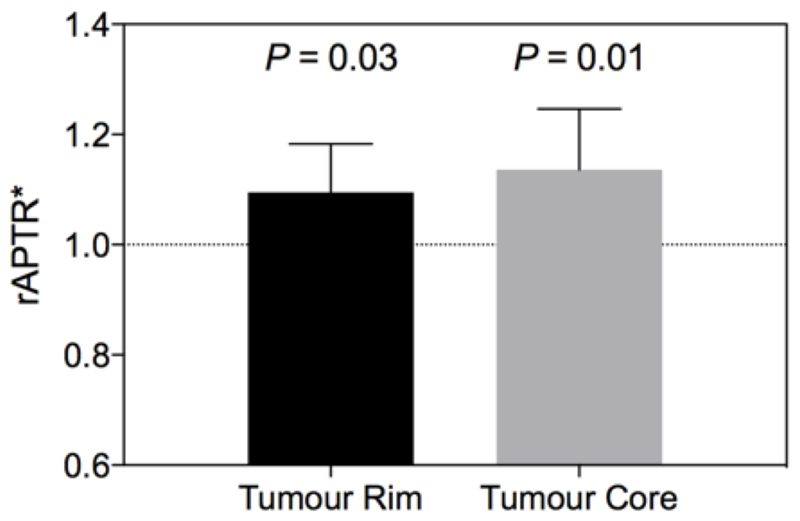
Figure 2.
APTR* is elevated in both tumour rim and tumour core. P values show significance level of a one-sample t-test comparing to a hypothetical mean of rAPTR* = 1 (which would indicate no difference from normal tissue). Error bars are 95% CI. The number of voxels for each tissue type is 1347 for tumour rim, and 1475 for tumour core.

