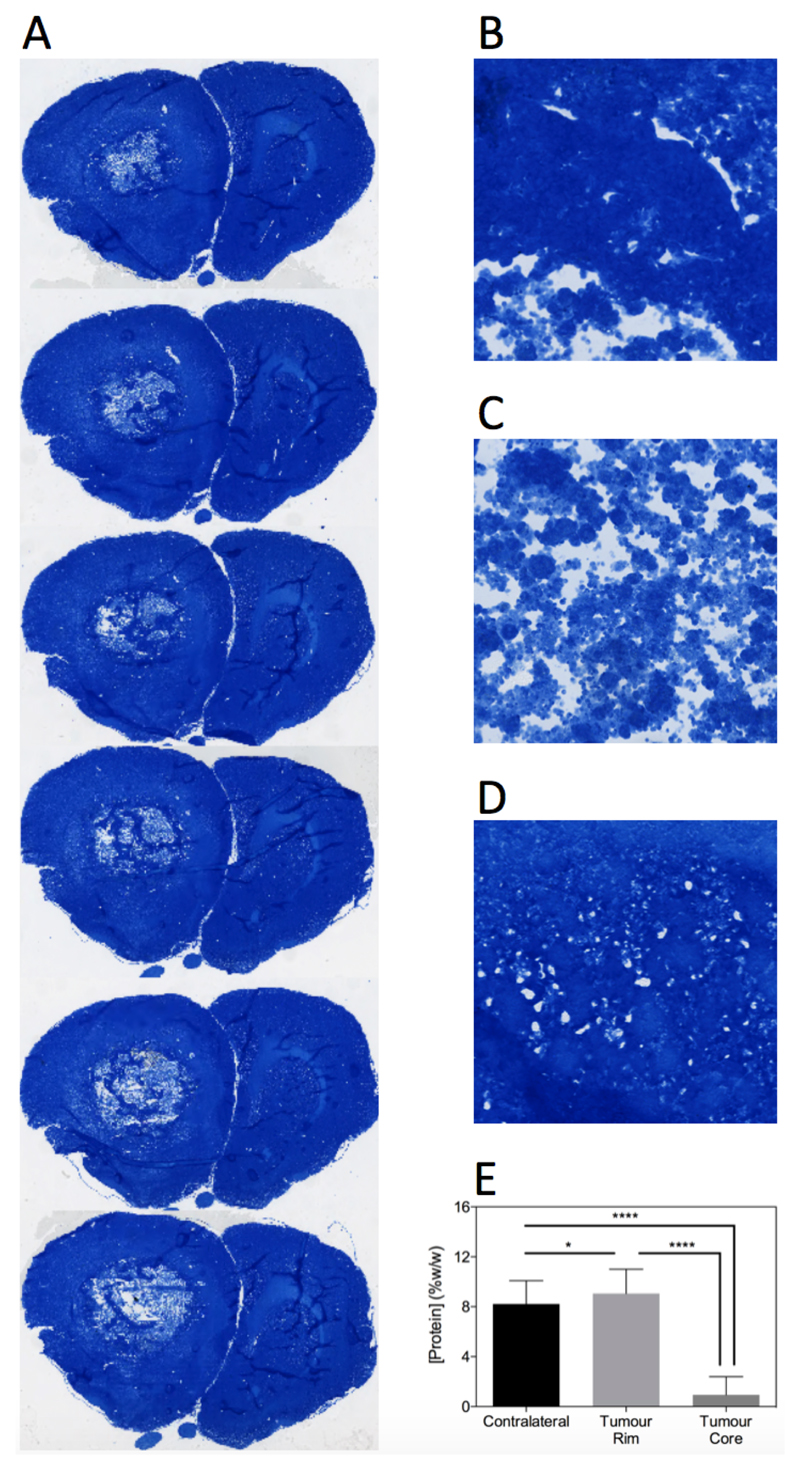
Figure 4.
Coomassie staining reveals the spatial heterogeneity of protein concentration in tumours. A. Examples of Coomassie stained tissue sections through a tumour of a representative rat. B-D. Magnified (200x) regions of tumour rim, tumour core and contralateral tissue, respectively. Group-wise protein concentration measurements (E) show that tumour rim has a significantly higher protein concentration than contralateral tissue, whereas tumour core has significantly lower protein concentration than contralateral tissue. **** = P < 0.0001, * = P < 0.05 (one-way repeated measures ANOVA, followed by Tukey’s multiple comparison test).

