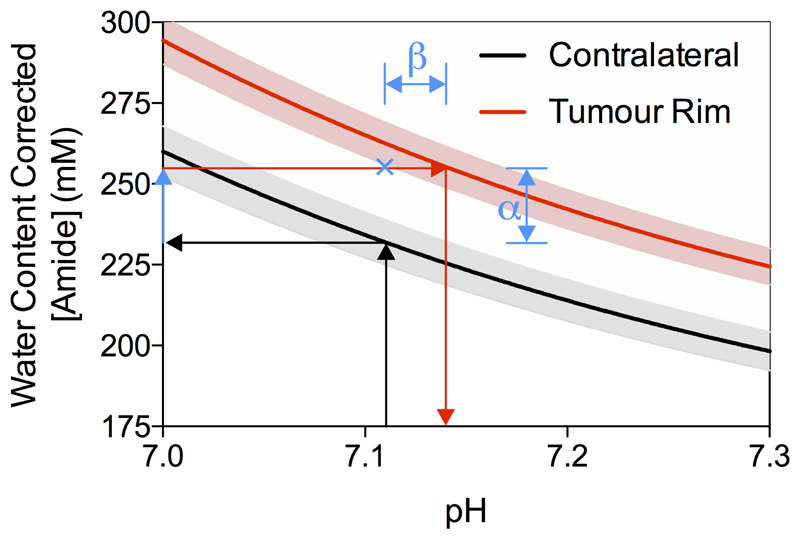
Figure 5.
Demonstration of the isoAPTR* method to measure the pH of ENU tumours. Black and red lines indicate the isoAPTR* lines for the APTR* values measured in the contralateral and tumour rim ROIs, respectively, with 95 % CI shown in grey for contralateral and pink for tumour rim. Arrows show the isoAPTR* methodology, where the contralateral tissue pH is assumed to be 7.11 and used with the measured APTR* to estimate the amide proton concentration. Using the relative increase in protein concentration in the tumour rim tissue measured by Coomassie staining, a tumour pH of 7.14 ± 0.01 is measured. The blue cross shows the APTR* value that would be expected with no pH change in the tumour, indicating that approximately 66% of the observed APTR* change reflects protein concentration changes (α), with the remaining 34% a result of pH changes in the tumour (β).

