Figure 1.
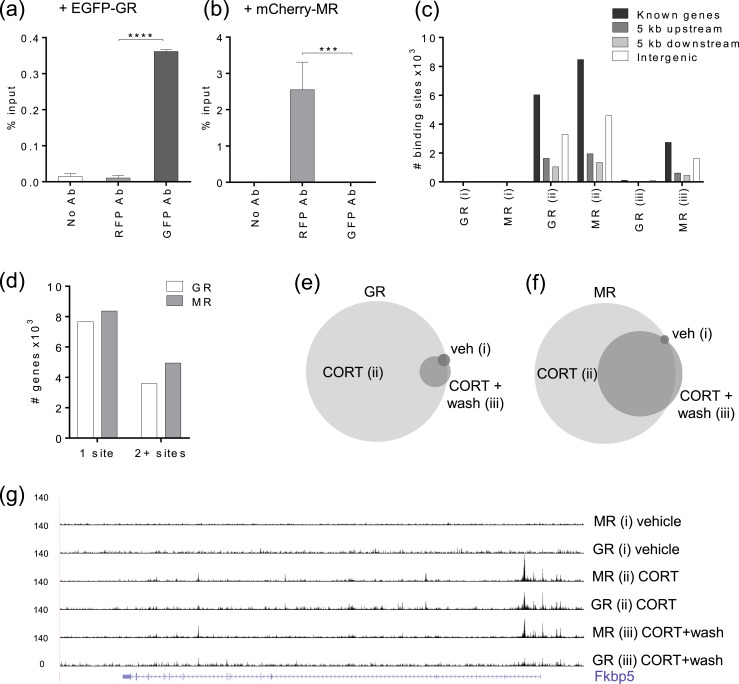
ChIP-nexus identifies GR and MR binding sites in N2A cells. (a and b) ChIP-qPCR showing specificity of (a) GFP and (b) RFP antibodies. N2A cells transiently transfected with EGFP-GR show the ChIP-qPCR signal detected by the GFP antibody with minimal cross-reactivity to the RFP antibody. Transfection with mCherry-MR shows the ChIP-qPCR signal detected by the RFP antibody with minimal cross-reactivity to the GFP antibody. EGFP-GR and mCherry-MR were cotransfected with shRNA to NR3C1-3′UTR to minimize possible endogenous GR effects, treated with 100 nM CORT for 20 min, and primers were located at the Sgk1 gene. Data are represented as means relative to percentage input ± SEM (n = 3; one-way ANOVA with a Tukey test). (c) Graph shows the distribution of MACS2-identified GR and MR binding sites within known genes, 5 kb upstream, 5 kb downstream, and intergenic regions for each treatment group: (i) vehicle for 20 min, (ii) 100 nM CORT for 20 min, and (iii) 100 nM CORT for 20 min, washout, and further incubation for 40 min. (d) Graph shows the number of genes with single or multiple associated binding sites for GR/MR with treatment (ii). (e and f) Area-proportional Venn diagrams show the proportions of GR and MR MACS2 binding sites that directly overlap by at least 1 bp between treatments (i), (ii), and (iii). (g) University of California Santa Cruz Genome Browser image at the Fkbp5 gene shows comparison of mapped MR and GR ChIP-nexus data for each treatment group. ***P < 0.001; ****P < 0.0001. Ab, antibody; veh, vehicle.

