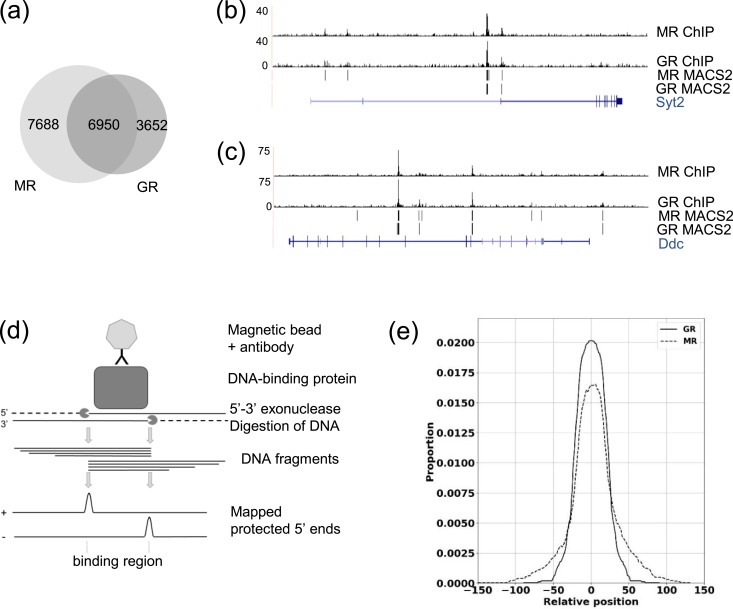
Figure 3.
MR and GR binding sites are highly similar. (a) Area-proportional Venn diagram shows MACS2 binding sites for MR that directly overlap with GR binding sites by at least 1 bp after 20 min of CORT (treatment ii). (b and c) University of California Santa Cruz Genome Browser images of mapped ChIP-nexus data and MACS2 peaks for MR/GR in mCherry-MR– and EGFP-GR–transfected N2A cells after 20 min of CORT (treatment ii) at the (b) Syt2 gene and (c) Ddc gene. (d) Diagram shows how λ-exonuclease digestion of ChIP fragments defines the binding regions. (e) Distribution of coverage for the MACE-predicted binding regions for GR and MR after CORT for 20 min (treatment ii) shows highly similar binding locations.

