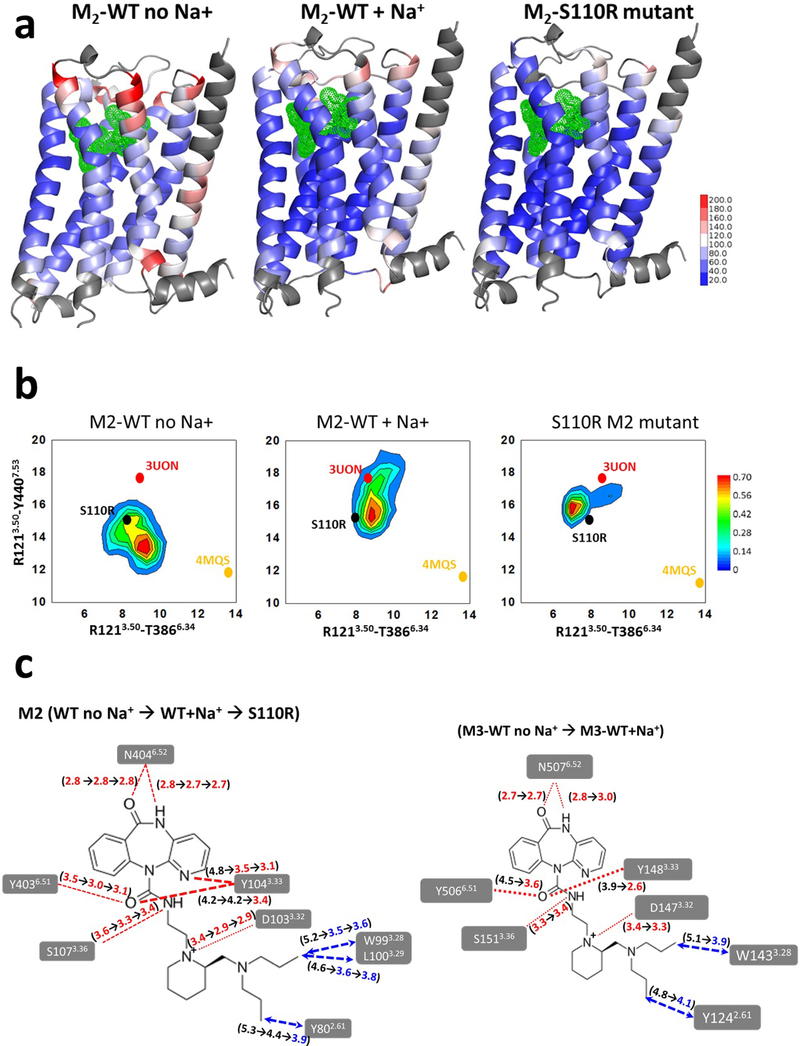
Figure 5.
Analysis of structural stabilization of the S110R M2 mutant compared to the wild type M2 using MD simulations. (a) The residue based thermal B-factor calculated from the MD simulations from the RMSF of the wild-type M2 receptor with and without sodium ion, and the S110R mutant are shown as a heat map on the representative conformation extracted from the most populated conformation cluster. The loop regions and the N-terminus of the receptor on TM1 shown in grey are omitted in the representation for clarity (b) The conformational ensemble sampled during the MD simulations of S110R mutant compared to the wild type with and without Na+ ion for M2 receptor. These two inter-residue distances between TM3-TM6 and TM3-TM7 are used as measures to assess the extent of the conformational changes in the three systems. The crystal structures of inactive and fully active states of M2 are indicated as 3UON for and 4MQS in the figure just for reference. (c) Changes in the average ligand residue distances during the MD simulations (left) from M2 wild-type without sodium ions to M2 wild-type with sodium ions and to S110R M2 mutant, and (right) from M3 wild-type without sodium ions to M3 wild-type with sodium ions.

