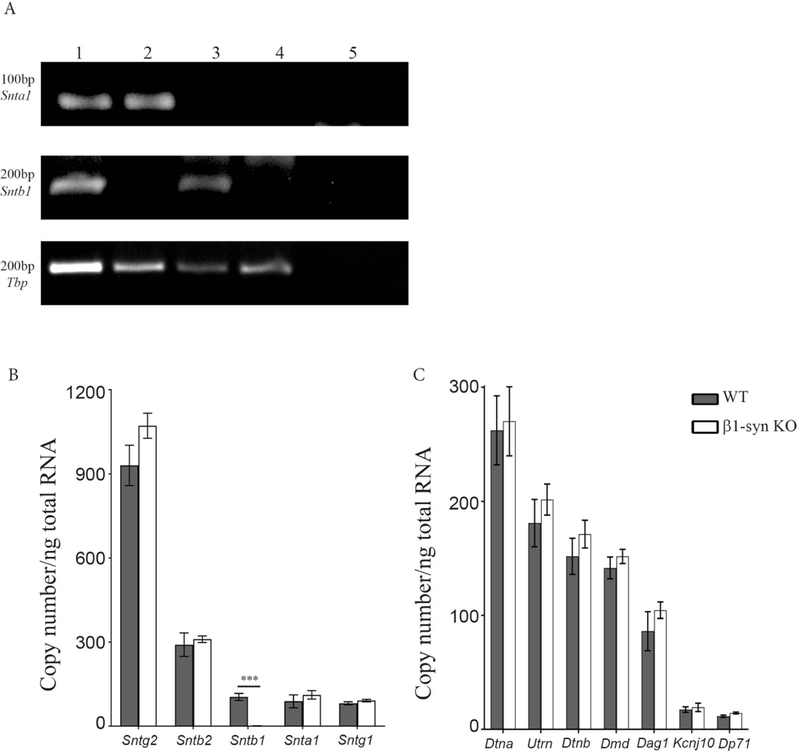
Figure 1: Gene expression analysis in β1-syn KO mice.

a) Representative DNA agarose gel electrophoresis showing the expression profile of Snta and Sntb in mouse eye samples. PCR products were generated using representative cDNA samples of WT (lane 1), β1-syn KO (lane 2), α1-syn KO (lane 3) and αβ1-syn KO (lane 4) as indicated above each lane on the gel. Lane 5 is the control for detecting genomic DNA contamination where the reverse transcription enzyme was excluded. Primers were tested for α1-syntrophin (top), β1-syntrophin (middle) and Tbp (bottom). TATA-box Binding Protein (Tbp) was used as a loading control across samples in the 40-cycle endpoint PCRs using Paq5000 DNA Polymerase (Agilent Genomics) and specific primers (Table 1). PCR product sizes in base pairs are shown to the left. b) Quantitative real time PCR analysis showed differential expression of syntrophin family of genes. Tbp was used as the normalization gene. We did not detect any signal for β1-syn KO when compared to WT (104±12 vs. 1.4±0.1 mean copy number/ng of total RNA). No statistical difference was observed in any of the other syntrophins between WT and β1-syn KO. The mean copy number was found to be highest for Sntg2, followed by Sntb2 where as Sntb1, Snta1 and Sntg1 had lower expression. Data presented as mean±SEM. ***p<0.001. c) Quantitative real time PCR analysis was performed on members of dystrophin associated protein complex. The following genes were tested to compare the expression levels between WT and β1-syn KO: full length Dystrophin (Dmd) and its shorter isoform (Dp71), Dystroglycan (Dag1), Dystrobrevin-alpha and beta (Dtna and Dtnb), Kir4.1 (Kcnj10) and Utrophin (Utrn). We did not find any statistical difference between the two genotypes. Data presented as mean±SEM.
