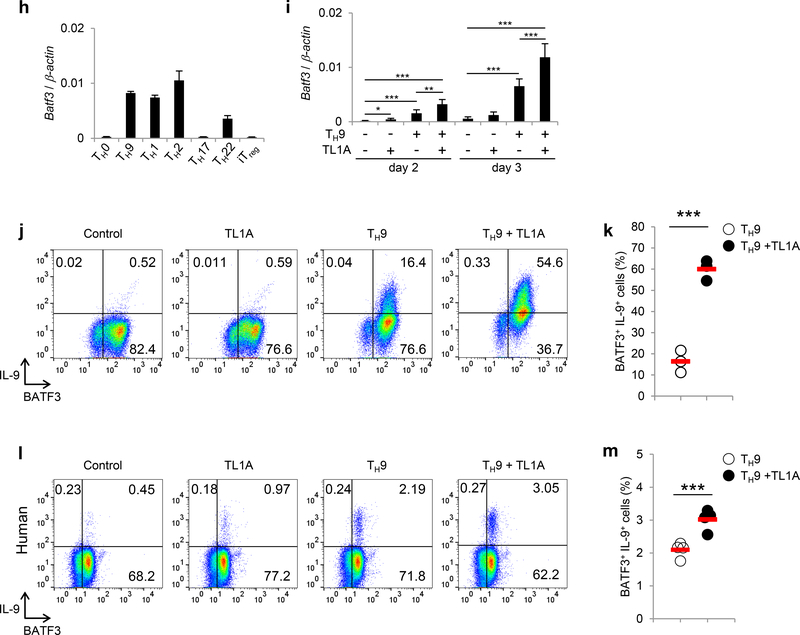
Figure 2. TL1A upregulates BATF and BATF3 expression during TH9 differentiation.
(a) Transcriptional profiling of TH9 and TH9-TL1A cells by RNA sequencing. Heat map displaying RNA sequencing data using the top 100 genes with the largest IQR (Interquantile Range). The dendrograms to the left and above the heat map represent clustering of genes (rows) and samples (columns). (b) Naïve CD4+ T cells were differentiated into different TH subsets and Tregs for 3 days. Relative Batf mRNA expression was analyzed by qPCR. (c) Naïve CD4+ T cells were differentiated under TH0- or TH9-polarizing conditions with or without TL1A for the indicated time periods. QPCR analysis of relative Batf mRNA expression. (d) Co-staining of BATF and IRF4 (top). Quantitative analysis of percentages of BATF+IRF4+ cells (bottom). (e) Co-staining of BATF and IL-9. (f-g) Naïve human CD4+ T cells were isolated from PBMCs of healthy volunteers and differentiated under TH9-polarizing conditions with or without TL1A. (f) Representative intracellular staining of IL-9 and BATF at 48 h. (g) Frequency of BATF+IL-9+ T cells differentiated under TH9 and TH9-TL1A conditions. Means are shown. Each symbol represents an individual donor. N=4. (h) Relative Batf3 mRNA expression in different murine TH subsets and Tregs was analyzed by qPCR. (i) Relative Batf3 mRNA expression at indicated time points. (j) Representative co-staining of BATF3 and IL-9. (k) Frequency of BATF3+IL-9+ T cells differentiated under TH9 and TH9-TL1A conditions. Means are shown. Each symbol represents an individual experiment. N=3. (l-m) Naïve human CD4+ T cells were differentiated under TH9-polarizing conditions with or without TL1A. (l) Representative intracellular staining of IL-9 and BATF3 at 48 h. (m) Frequency of BATF3+IL-9+ T cells differentiated under TH9 and TH9-TL1A conditions. Means are shown. Each symbol represents an individual donor. N=4. Data represent means ± SD of one independent experiment out of two (a) or at least three (b-e, h, i) independent experiments. *, p<0.05, **, p<0.01, ***, p<0.005 as determined by Student’s t-test.


