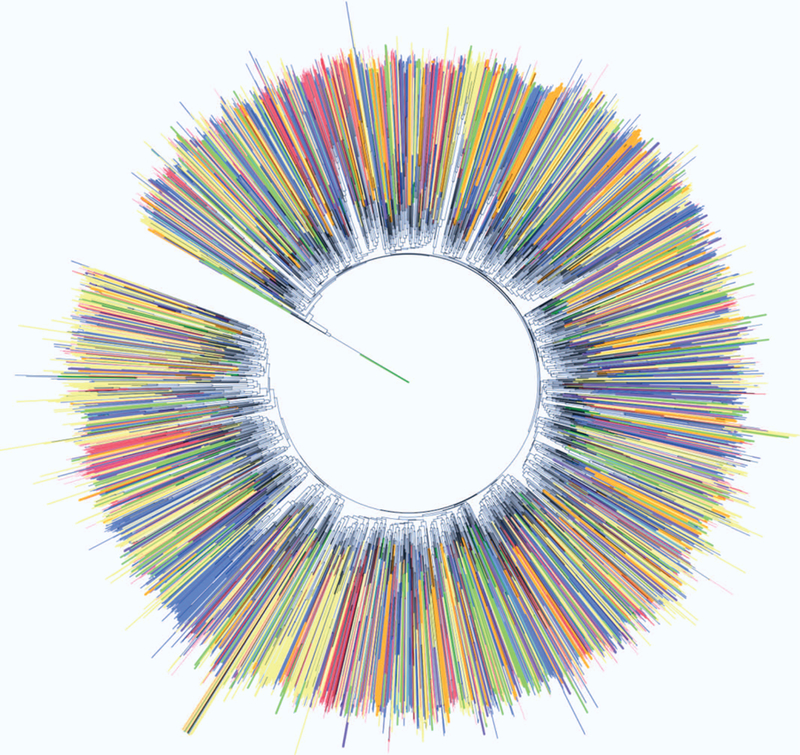
Figure 3.

A phylogenetic tree of 4431 representative CPASS active sites from the RCSB PDB is presented. The phylogenetic tree highlights the functional evolutionary relationships between protein active-site structures. Leaves are colored according to the first EC number of the annotated active-site (1: oxidoreductases, red; 2: transferases, blue; 3: hydrolases, yellow; 4: lyases, green; 5: isomerases, purple; 6: ligases, orange; not annotated: black). An annotated, searchable and interactive phylogenetic tree is located at the iTOL 31 website http://itol.embl.de/shared/jcatazaro.
