
Figure 2. Gq activation in astrocytes elevates their Ca2+ levels.
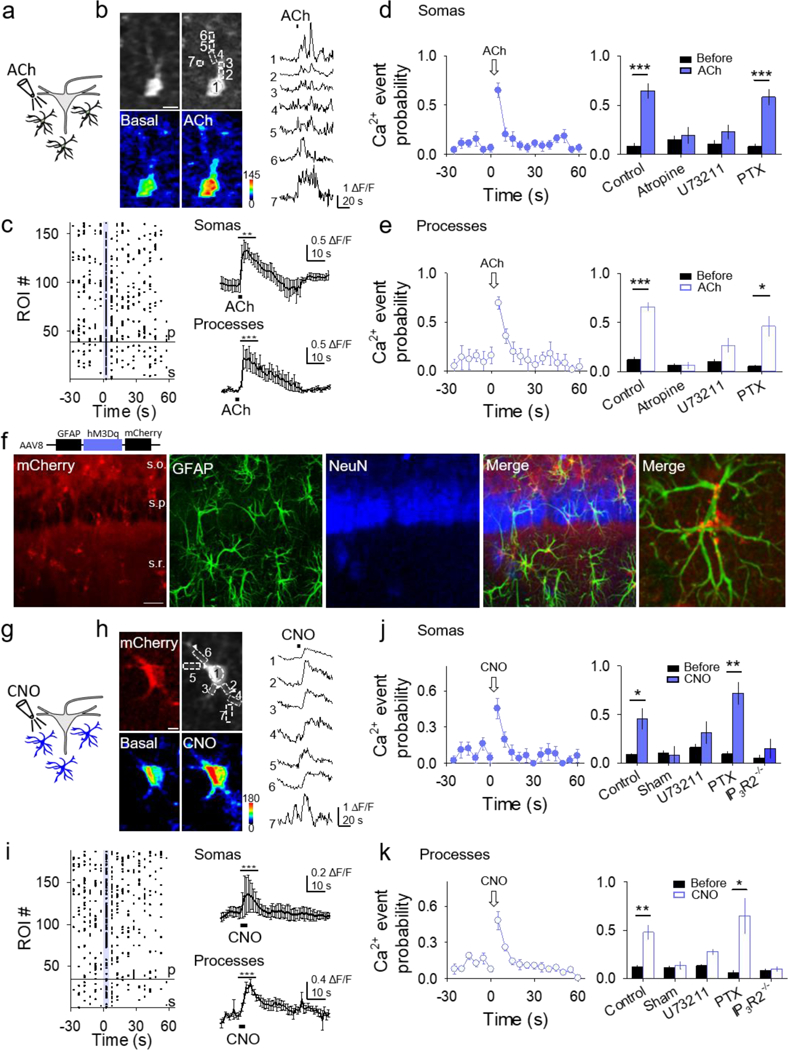
(A) Scheme of Gq GPCR activation in astrocytes by ACh locally applied over stratum radiatum astrocytes. (B) Fluorescence images of an astrocyte showing selected domains in soma and processes (top), pseudocolor Ca2+ images before (basal) and after local application of ACh (bottom) (scale bar, 5 μm), and Ca2+ traces from domains shown in top right panel. (C) Left: Raster plot showing Ca2+ events for each ROI (somas (s) below reference line, processes (p) above reference line). Right: Average Ca2+ traces from responding somas (top) and processes (bottom). T-test compares 10s before and 10s after agonist. (D and E) Ca2+ event probability in somas (D) and processes (E) vs. time, and maximum values in different conditions. (F) Immunohistochemical images of AAV8-GFAP-hM3Dq-mCherry expression in the hippocampus. From left to right: Expression of mCherry, GFAP, NeuN, a merge of all three, and a higher magnification merge image showing colocalization of GFAP and mCherry (25x; scale bar, 20 μm; s.o., stratum oriens; s.p., stratum pyramidale; s.r., stratum radiatum). (G-K) as (A-E) but with local application of CNO to GqDREADD expressing astrocytes instead of ACh. Data are represented as mean ± SEM. P < 0.05 (*), P < 0.01 (**), and P < 0.001 (***).