
Figure 3. Gi/o activation in neurons is inhibitory.
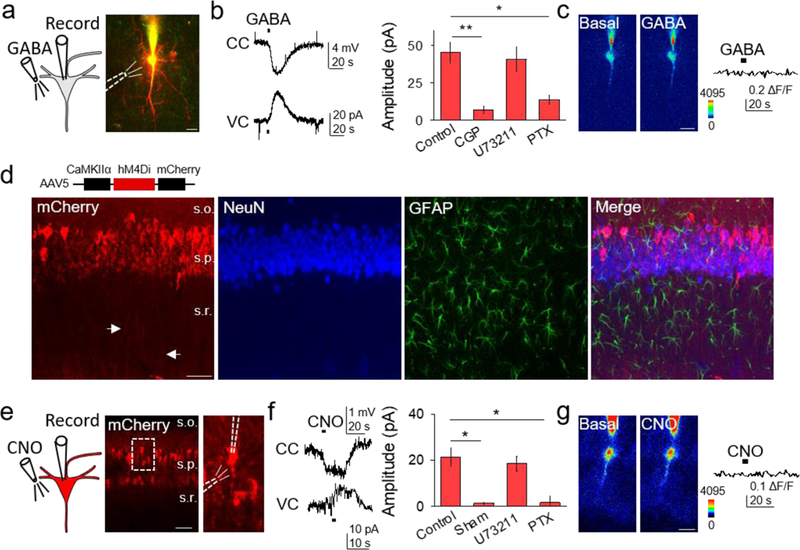
(A) Scheme of neuronal Gi/o activation by GABA, and TexasRed and Fluo4-filled CA1 neuron (scale bar, 20μm). (B) Representative traces showing GABA-induced responses in current clamp (CC) and voltage clamp (VC), and GABA-induced current amplitude in different conditions (Kruskal-Wallis One-way ANOVA, p < 0.01, p < 0.05). (C) Pseudocolor Fluo4 images before and after GABA application from the neuron depicted in (A) (scale bar, 20µm), and the corresponding fluorescent Ca2+ trace. (D) Immunohistochemical images of AAV5-CaMKIIα-hM4Di-mCherry expression in hippocampus. From left to right: mCherry, NeuN, GFAP and merge (scale bar, 50 μm; s.o., stratum oriens; s.p., stratum pyramidale; s.r., stratum radiatum). (E) Scheme of neuronal chemogenetic Gi/oDREADD activation and fluorescent image showing mCherry-expressing neurons (scale bar, 50µm). (F) Representative traces showing CNO-evoked responses in CC and VC, and CNO-induced current amplitude in different conditions (Kruskal-Wallis One-way ANOVA, p < 0.05). (G) Pseudocolor Fluo4 images before and after CNO application (scale bar, 20µm), and corresponding fluorescent Ca2+ trace. Data are represented as mean ± SEM. P < 0.05 (*) and P < 0.01 (**).